 Excel is a spreadsheet
application that is widely used in the finance industry. It allows you to
store and manipulate data, perform calculations, and create charts and
graphs. In this chapter, we will cover the basics of Excel that you need to
know to build a backtesting spreadsheet.
Excel is a spreadsheet
application that is widely used in the finance industry. It allows you to
store and manipulate data, perform calculations, and create charts and
graphs. In this chapter, we will cover the basics of Excel that you need to
know to build a backtesting spreadsheet.
Microsoft Excel is a widely
used software application for creating spreadsheets and performing
calculations. It is a part of the Microsoft Office suite of productivity
software, which also includes Microsoft Word, PowerPoint, and other
programs. Microsoft Office is one of the most popular software suites in the
world, and it is used by millions of people for both personal and business
purposes, everyday. In fact, it's so ubiquitous that it's practically become
a household name, with many people referring to any office software as
"Microsoft Office," whether it's made by Microsoft or not.
For example, let’s calculate
the SMA for a stock’s prices or index with Excel.
SMA stands for Simple Moving
Average and is a commonly used technical analysis indicator. It is a lagging
indicator and provides a smoothed average of the price over a certain period
of time, often used by traders to identify trends and to help determine buy
and sell signals. The formula for calculating the SMA is:
SMA = Sum of Closing Prices for a period / Number of periods
In Excel, it looks like
this:
To calculate the 5-day SMA,
you would add up the closing prices of the last 5 days and then divide by 5.
To calculate the 10-day SMA, you would add up the closing prices of the last
10 days and then divide by 10.
Excel has many formulas to
help users with almost every calculation in a blink. To calculate the 5-day
SMA, the formula
SMA = Sum of Closing Prices for a period / Number of periods
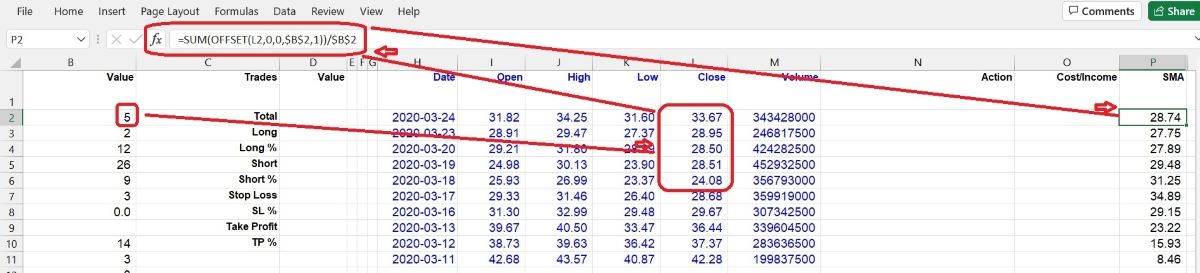
will be turned into Excel's
language like this:
=SUM(OFFSET(L2,0,0,$B$2,1))/$B$2
The cell B2 stores the
period (in this case, it is 5), and the cell L2 stores the Close Price. The
final result will be stored in cell P2, and so on. We can have another
simpler formula to do this job:
=AVERAGE(OFFSET(L2,0,0,$B$2,1))
In addition to the formulas
available in Excel worksheets, Excel also provides users with a powerful
tool for more customized calculations and actions. This tool is known as
VBA, or Visual Basic for Applications. With VBA, users can write code to
automate tasks, perform complex calculations, and create custom functions to
suit their specific needs. VBA allows for greater flexibility and control
over Excel's features and functionality, making it a valuable tool for
advanced users and programmers.
The most important and
interesting thing is: VBA is an integral part of Microsoft Excel, and you
don't need to install it separately as you would with other programming
languages such as Python. This is because VBA is a built-in programming
language that is designed specifically for Excel and other Microsoft Office
applications. This means that anyone who has Microsoft Office installed on
their computer already has access to VBA and can start using it right away.
With VBA, users can automate repetitive tasks, create custom functions, and
build complex applications within Excel, all without the need for any
additional installations or software.
If you are using Microsoft
Office, you don’t need to pay any extra fees for VBA. With VBA, users can
write their own Macros and functions to automate repetitive tasks, create
custom functions and procedures, manipulate and analyze data in ways that
are not available through standard Excel functions, and even create user
interfaces for their spreadsheets.
The term "Macro" is derived
from "Macrosimulation", which originally referred to computer programs used
for economic forecasting and analysis. In VBA and Excel, a Macro refers to a
set of instructions or commands that can be executed automatically to
perform a specific task and improve efficiency.
VBA is a well-established
tool with a low probability of errors during installation and usage.
Compared to other complex software, VBA does not require technical
maintenance from users, as Microsoft will handle it. This makes VBA a
hassle-free and user-friendly tool for users.
For example, with VBA, users
can create a custom function that calculates a complex mathematical formula,
automate data entry by creating a form that users can fill out, and create
interactive dashboards that display and update data in real-time.
VBA is a powerful tool, but
it does require some programming knowledge to use effectively. However,
there are many resources available online to help users learn VBA, including
tutorials, forums, and even complete courses.
The syntax of VBA is similar
to other programming languages, such as C++, Java, and Python. But it is
much easier than those big guys. It consists of a set of statements that are
executed in order, and these statements can include conditional statements
(if-then-else), loops (for-next, do-while), and procedures (subroutines and
functions).
For example, if we decide to
make a trading strategy like this:
When the 10-day SMA goes up
across the 100-day SMA, then open Long position (Buy), while the short term
SMA goes down across the long term SMA, then open Short position (Sell). In
VBA, we can write the Signal Generation part as:
Private Sub Signals()
Private LongOK,
ShortOK As Boolean
Private BuyPrice, SellPrice As Double
Dim
Trigger, SMA10day, SMA100day As Double
Dim Candle As Long ‘Candle
means current candlestick
Trigger = [B8].Value ‘an action
standard is stored in cell B8
‘SMA10day is calculated by formula and
stored in column P
‘SMA100day is calculated by formula and stored in
column Q
If (Cells(Candle + 1, "P").Value - Cells(Candle + 1,
"Q").Value) < 0 And _
(Cells(Candle, "P").Value - Cells(Candle,
"Q").Value) / Cells(Candle, "Q").Value > Trigger Then
‘The “Candle +
1” means one stick before current candlestick. The short term SMA is
stored in column P, long term SMA is stored in column Q. This “If… Then”
is talking about: one day ago, the short term SMA was lower than the
long term SMA, but today the short term SMA is higher than the long term
SMA and crosses above the long term SMA at a certain point, the
difference is bigger than the Trigger, then the Long signal goes to OK.
LongOK = True
Exit Sub
End If
If (Cells(Candle + 1,
"P").Value - Cells(Candle + 1, "Q").Value) > 0 And _
(Cells(Candle,
"P").Value - Cells(Candle, "Q").Value) / Cells(Candle, "Q").Value < -1 *
Trigger Then
‘The “Candle + 1” means one stick before current
candlestick. The short term SMA is stored in column P, long term SMA is
stored in column Q. This “If… Then” is talking about: one day ago, the
short term SMA was higher than the long term SMA, but today the short
term SMA is lower than the long term SMA and crosses below the long term
SMA at a certain point, the difference is bigger than the Trigger, then
the Short signal goes to OK.
ShortOK = True
Exit Sub
End If
‘Open Long
If LongOK = True And ShortOK = False Then
Call
OpenLong ‘execute a subroutine to Open a Long position (Buying)
Cells(Candle, "N").Value = "Buy/Open @ “ & BuyPrice
End If
‘Open Short
If ShortOK = True And LongOK = False Then
Call
OpenShort ‘execute a subroutine to Open a Short position (Selling)
Cells(Candle, "N").Value = "Sell/Open @ “ & SellPrice
End If
End Sub
See? It is very easy to
understand, eh? Everybody can do it. Of course, this Signal Generation
procedure is just one small part of a whole VBA backtesting program. We have
included it here for demonstration purposes only.
In summary, VBA is a
powerful tool that can be used to extend the capabilities of Excel and
automate repetitive tasks, making it a valuable asset for anyone who works
with large amounts of data. And surprisingly, it looks like born for
building a simple backtesting tool which can verify your trading strategies,
no matter trading stocks or FOREX, if you are a fan of technical analysis
methodology.
Congratulations, you've made
it this far! If you're feeling overwhelmed, don't worry, just remember that
Excel and VBA are like a pair of shoes - it takes some time to break them
in, but once you do, they'll be a perfect fit. And who knows, maybe one day
you'll look back at this chapter and laugh at how clueless you once were.
Until then, keep practicing and remember, with great power comes great
responsibility...and even greater spreadsheets!
LIGHTING THE PATH TO PROFITABLE TRADING
(the whole tutorial handbook pdf Free Download)
A Step-by-Step Guide to Building a Trading
Strategy Verification Tool with VBA Macros