CHAPTER 2: WHAT IS BACKTESTING AND WHY IS IT SO IMPORTANT
|
|
 Backtesting is essential in stock trading because
it allows you to evaluate the performance of a trading strategy based on
historical market data. By backtesting a trading strategy, you can determine
how well it would have performed in the past, which can give you an idea of
how well it is likely to perform in the future. Backtesting is essential in stock trading because
it allows you to evaluate the performance of a trading strategy based on
historical market data. By backtesting a trading strategy, you can determine
how well it would have performed in the past, which can give you an idea of
how well it is likely to perform in the future.
Backtesting can also
help you identify any flaws or weaknesses in your trading strategy. For
example, if your strategy performs poorly during certain market conditions,
you can modify it to improve its performance in those conditions.
In
addition, backtesting can help you set realistic expectations for your
trading strategy. By evaluating its performance over a long period, you can
get a good idea of the average returns and drawdowns you can expect from the
strategy. This can help you avoid overestimating the potential profits of
your strategy and taking on too much risk.
To perform a backtest, you
need to:
Define the rules of the trading strategy: This involves
specifying the entry and exit conditions of the strategy, such as when to
buy or sell a stock based on certain technical indicators.
Gather
historical market data: This involves collecting price data for the
securities you are interested in over the period you want to backtest.
Apply the trading strategy to the historical data: This involves
simulating the trades that would have been made by the strategy at each
point in time based on the historical market data.
Evaluate the
results: This involves analyzing the performance of the strategy in terms of
its profitability, risk, and other performance metrics.
Let's
consider an example of how backtesting works in practice. Suppose you want
to develop a simple trading strategy for a particular stock. Your strategy
involves buying the stock whenever its 50-day moving average crosses above
its 200-day moving average (a so-called 'Golden Cross'), and selling the
stock whenever the opposite occurs (known as a 'Death Cross'), as shown in
the chart below.
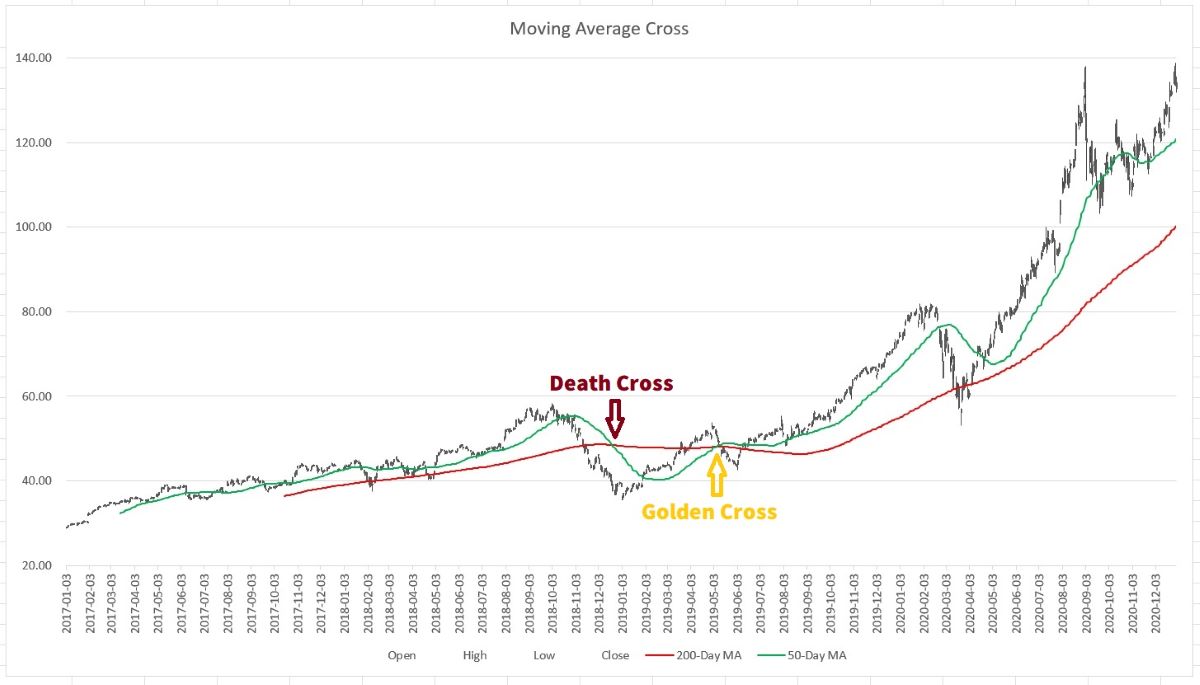
To backtest this strategy, you would need to gather historical price
data for the stock and calculate its 50-day and 200-day moving averages at
each point in time. You would then simulate trades using the trading
strategy and calculate the profit or loss that would have been made at each
point in time.
For example, we can create a VBA macro to
perform backtesting for the "Two Moving Average Lines Cross" trading
strategy. Do you remember the "10-day SMA and 100-day SMA" strategy code we
mentioned in Chapter 1? We can modify it, change the short term SMA to
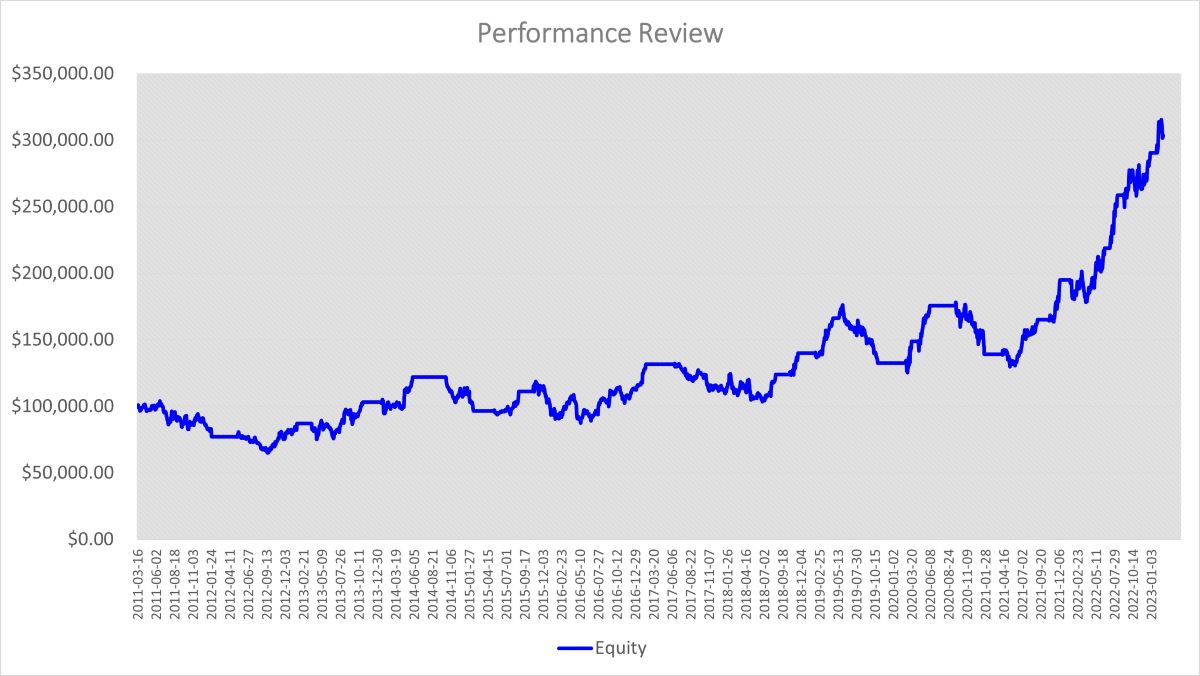
50-day, and the long term SMA to 200-day. Let's take AAPL (Apple Inc.'s
stock symbol) as an example. After downloading AAPL's historical data
(2011-01-03 ~ 2023-02-23) and running the VBA program, we will get a result
like this:
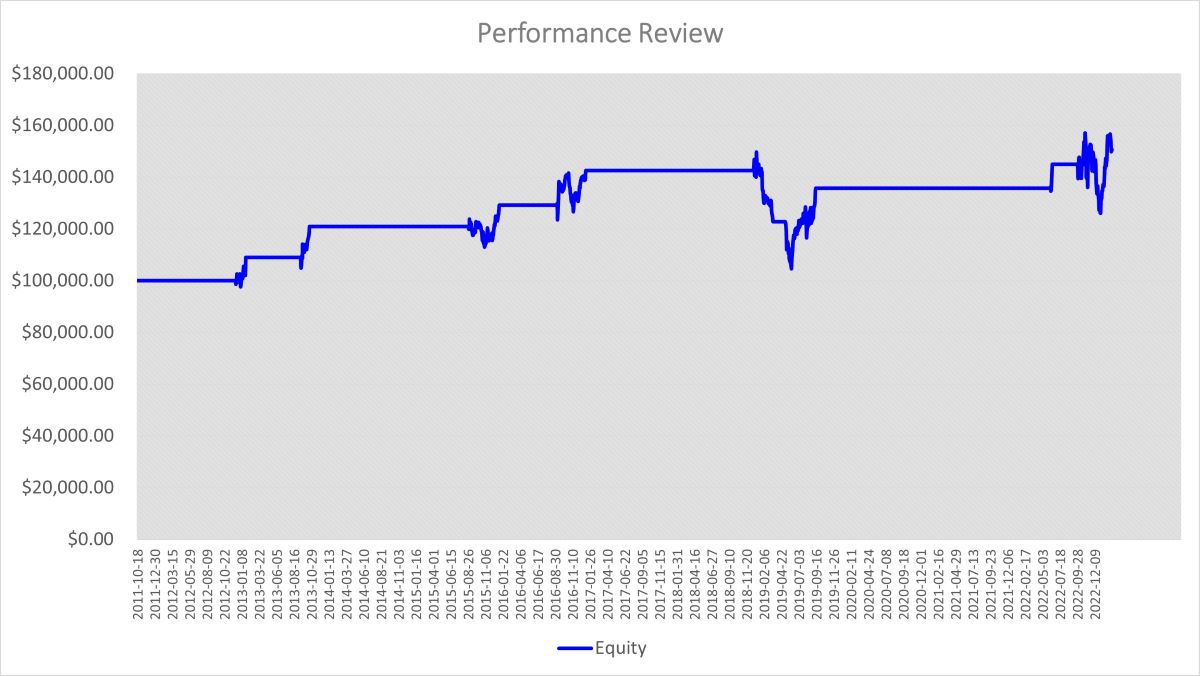
The result may not seem
impressive, eh? The trading strategy looks perfect, the company is famous
and strong. But when we deploy this trading strategy, the result is just
so-so. This case shows why a backtest can protect us from guesswork and
mystery, and a simple VBA program can save us a lot of time and money.
After performing the backtest, you would evaluate the results to
determine if the strategy is profitable and if it meets your risk and
performance criteria. For example, you might evaluate the strategy based on
metrics such as the average annual return, maximum drawdown, and Sharpe
ratio.
If the results are satisfactory, you perhaps can use the
strategy to make trades in real-time. If the results are not satisfactory,
you may need to refine the strategy or develop a new one altogether.
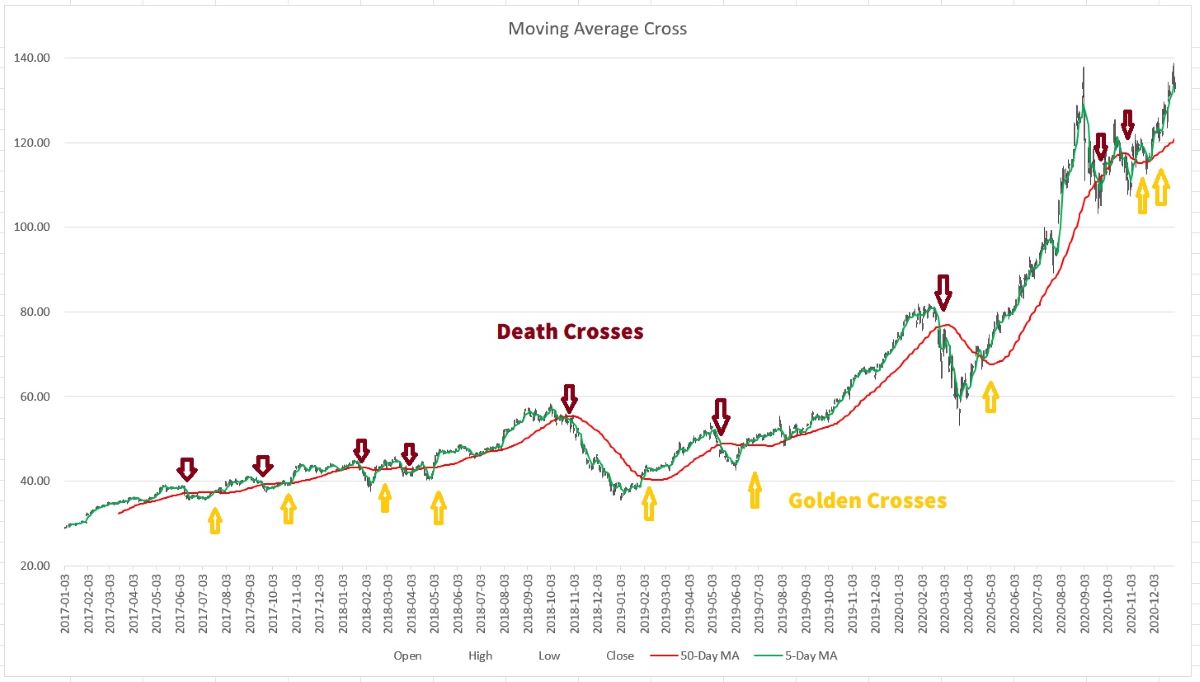
Let's go back to the 'Two Moving Average Lines Cross' trading strategy, and
adjust the parameters by setting the short-term SMA to 5 days and the
long-term SMA to 50 days. This will increase the chances of executing the
strategy. The chart will look like the one below:
Run the VBA Macro again.
Look at the
results above, much better, right? Let's dive into the details:
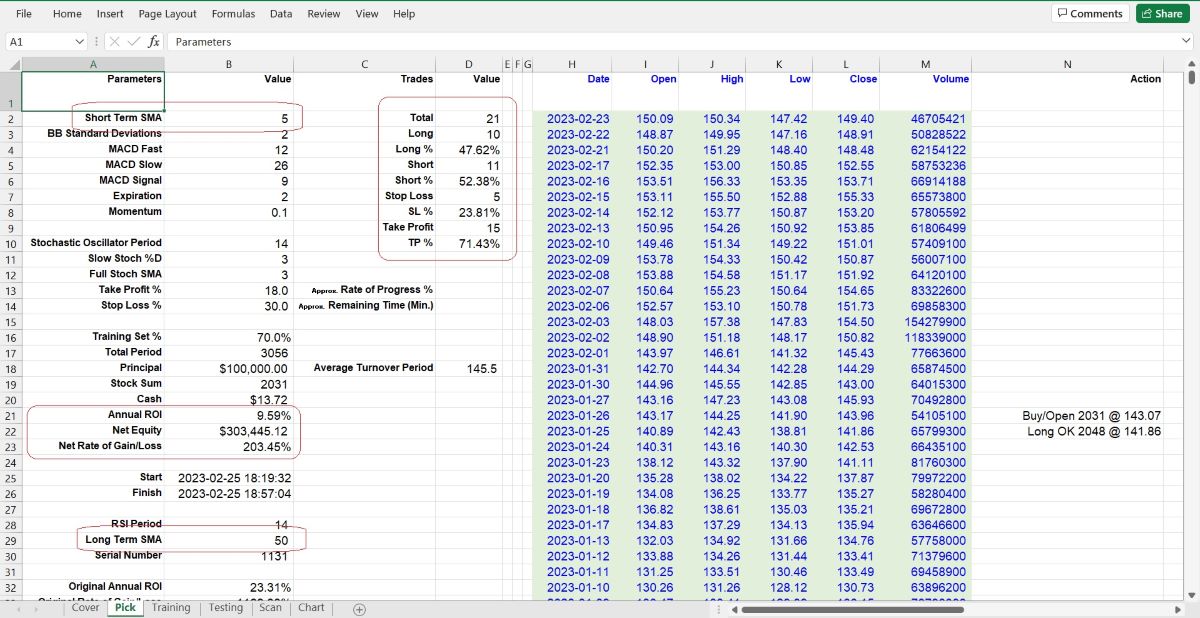
The Annual
ROI (Return on Investment) is 9.59%, which is higher than the average Annual
ROI of the S&P 500 index (6.9%). See the difference? With the same trading
strategy, same target, and same time period, just changing some parameters
can lead to significant differences in the result. If you do this manually,
it may take several days, if not weeks. However, by using VBA, it only takes
several minutes or hours. Conducting a backtest, it may seem like playing a
game of numbers. However, without it, we risk facing Life-or-Death
situations in real trading.
An Annual Return on Investment of around
10% is decent, OK but not a “WOW!” yet. Compared to Warren Buffett's average
ROI of 17% per year, there is much more room for improvement in the trading
strategy. The process of improving the strategy can be full of interesting
discoveries and surprises. We will continue to share more backtesting
details in the following chapters. For example, if we change the short-term
SMA to 20 days and set the long-term SMA to 50 days, like this:
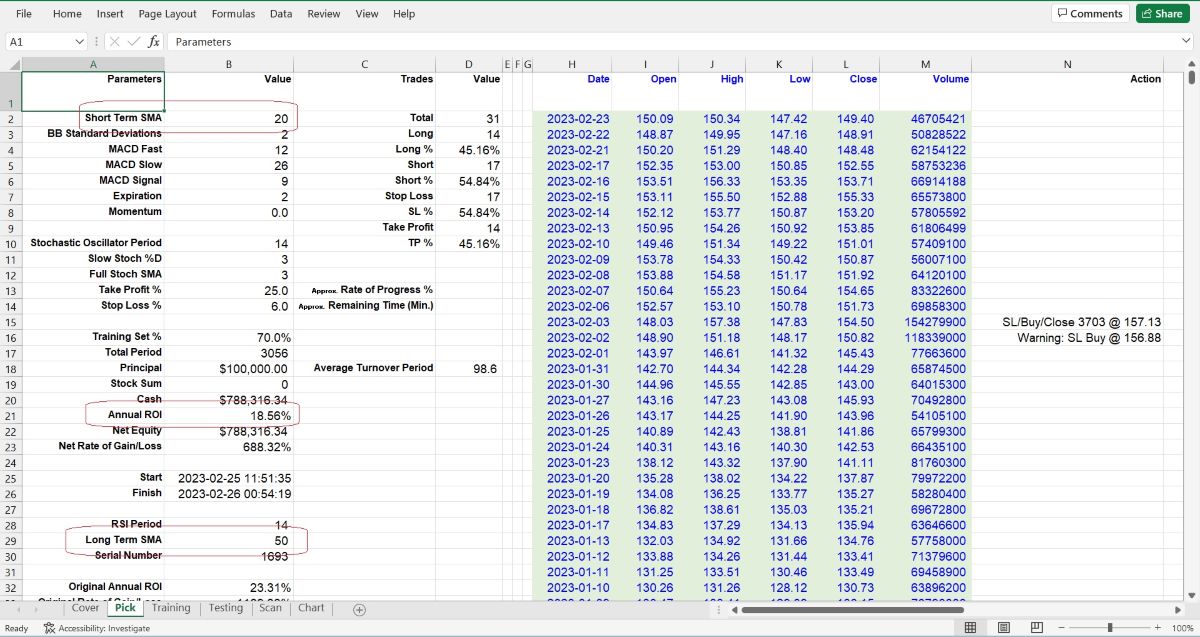
We
can double the ROI to 18%, which is neck-and-neck with Warren Buffett's
performance, as shown in the chart below:
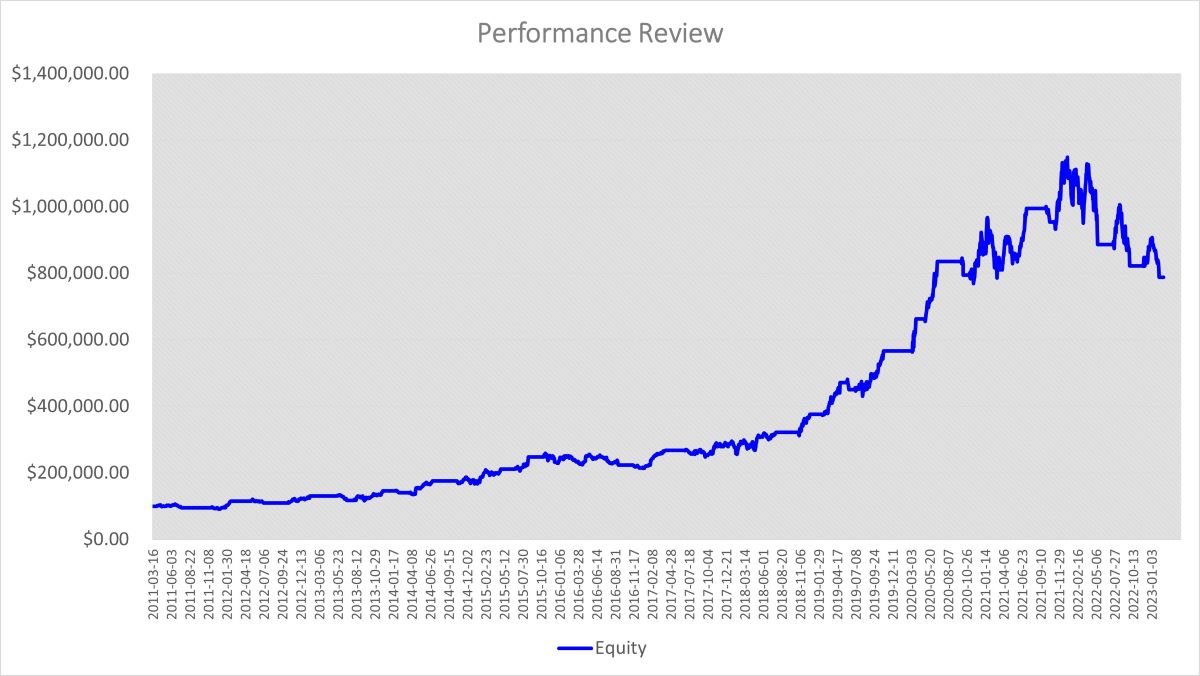
Now, backtesting brings us
a small "WOW!", doesn't it? Eh? In the following chapters, we will explain
the details of every part of VBA Macros which deploy different trading
strategies for different targets. Stay tuned.
In summary, backtesting
is an essential step in developing and evaluating trading strategies. It
allows you to test a strategy on historical market data and determine its
performance and potential profitability. Backtesting helps traders make
informed decisions and avoid costly mistakes when investing in the stock
market. Without it, you would have no way of knowing whether your strategy
is likely to be profitable or not, and you would be trading based on
guesswork and intuition rather than solid evidence.
As you can see,
the difference between a profitable trading strategy and a losing one can be
as small as a few parameter tweaks. In fact, some might say that trading is
just like cooking: you need to adjust the recipe until it tastes just right.
And if you're really good, you can make something that's not only tasty but
also nutritious. So go ahead, put on your chef hat and start backtesting
your trading strategies. Who knows, you might just cook up the next big
thing in the stock market!
LIGHTING THE PATH TO PROFITABLE TRADING
(the whole tutorial handbook pdf Free Download)
A Step-by-Step Guide to Building a Trading
Strategy Verification Tool with VBA Macros
|


|

Free Tutorial
Share
|
|
|
|
