|
 If your strategy is not
profitable, you need to make some changes to improve it. In this chapter, we
will cover some basic techniques for improving your trading strategies. If your strategy is not
profitable, you need to make some changes to improve it. In this chapter, we
will cover some basic techniques for improving your trading strategies.
Improving stock trading
strategies is a continuous process that requires traders to regularly
evaluate their strategies and make adjustments based on their performance.
Here are some steps that traders can take to improve their stock trading
strategies:
1.
Analyze the results: After
backtesting your trading strategies, analyze the results to determine the
strategy's profitability. Look for patterns in the data and identify areas
where the strategy is performing well or poorly.
2.
Identify weaknesses:
Identify any weaknesses in your strategy and determine the cause. For
example, if the strategy is failing to generate profits in a particular
market condition, it may need to be adjusted to account for that condition.
3.
Experiment with new ideas:
Try new ideas to improve your strategy. This may involve experimenting with
new indicators, adjusting your position sizing, or tweaking your entry and
exit rules.
4.
Keep a trading journal: Keep
a trading journal to track your trades and analyze your performance over
time. This will help you identify trends and patterns in your trading
behavior and allow you to make adjustments to your strategy accordingly.
5.
Stay up-to-date: Stay
up-to-date with the latest market data, trends and technologies, even some
high-tech such as Artificial Intelligence (AI), Machine Learning,
Quantitative Trading (Quant), or chatGPT etc,. This will help you adjust
your strategy to account for changes in market conditions and stay ahead of
the competition.
6.
Seek feedback: Seek feedback
from other traders and experts in the field. This can help you identify
areas where your strategy can be improved and give you new ideas for trading
more effectively.
This chapter, we would like
to introduce you to one method to improve your trading strategies, called
“Hybrid Power”. This involves blending two or more rules or indicators
together to filter out signal noise and identify real trading opportunities,
thereby increasing your chances of success and reducing your chances of
failure.
For example, let’s try
mixing Hammer and Shooting Star candlestick patterns and RSI indicator to
make a Hybrid trading strategy, and do some backtesting to verify how well
(or bad) this Hybrid Power machine (or monster) will run.
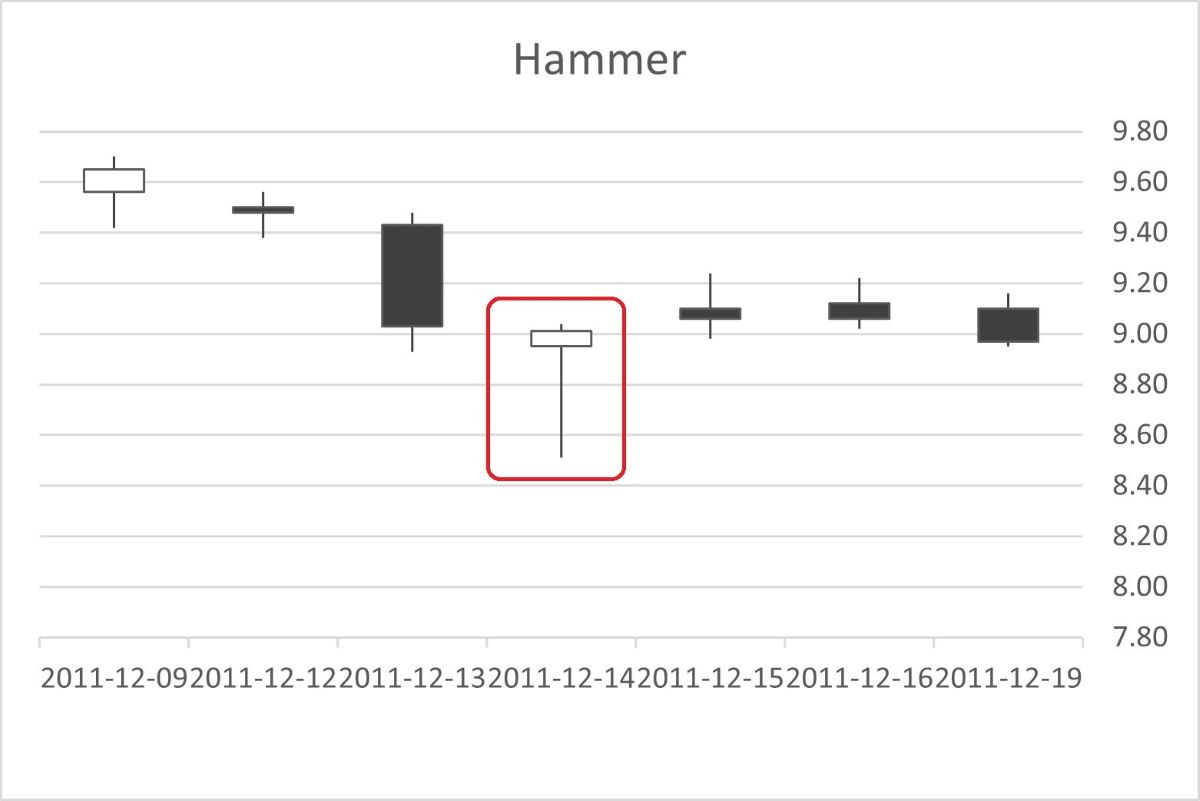
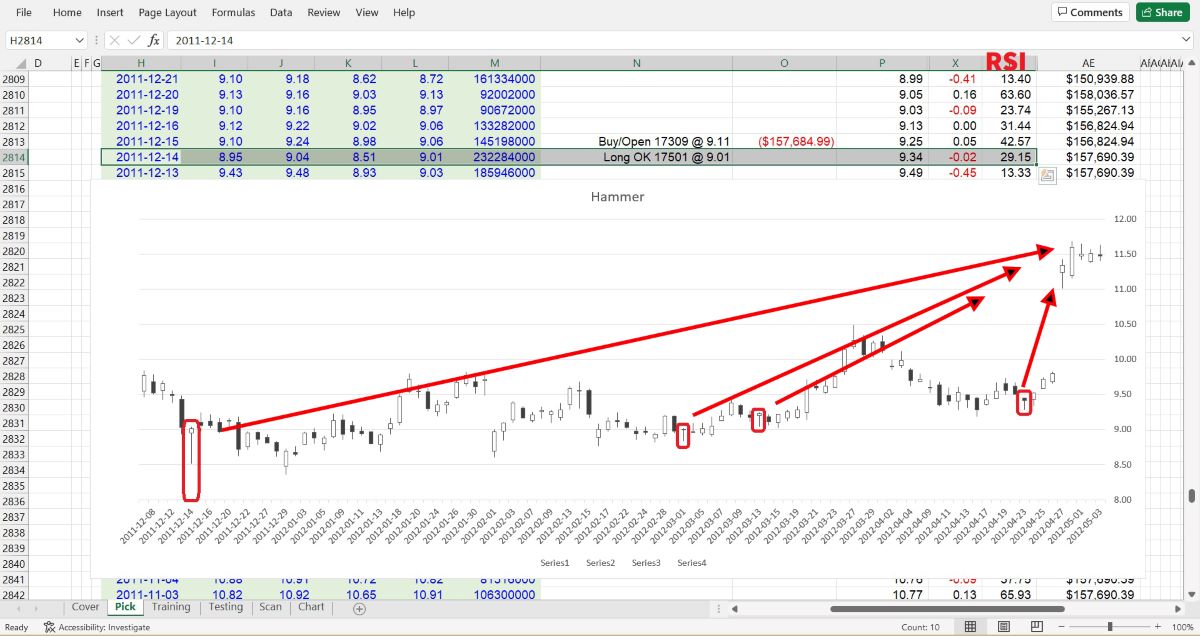
A hammer is a bullish
reversal candlestick pattern that can be identified on a stock chart. It is
formed when the price opens near its high, then drops during the day to a
low, but then recovers to close near the opening price. This creates a
candlestick shape that looks like a hammer, with a small real body and a
long lower shadow.
The hammer pattern is
significant because it shows that the price of the stock was pushed down
during the day by sellers, but then buying pressure came in to push the
price back up to the opening level. This suggests that the bulls have taken
control and that the price may start to rise.
Traders often look for
confirmation of the hammer pattern, such as a gap up on the next trading
day, or a move above the high of the hammer pattern. This helps to confirm
that the bullish momentum is continuing and can be used as a signal to buy
the stock.
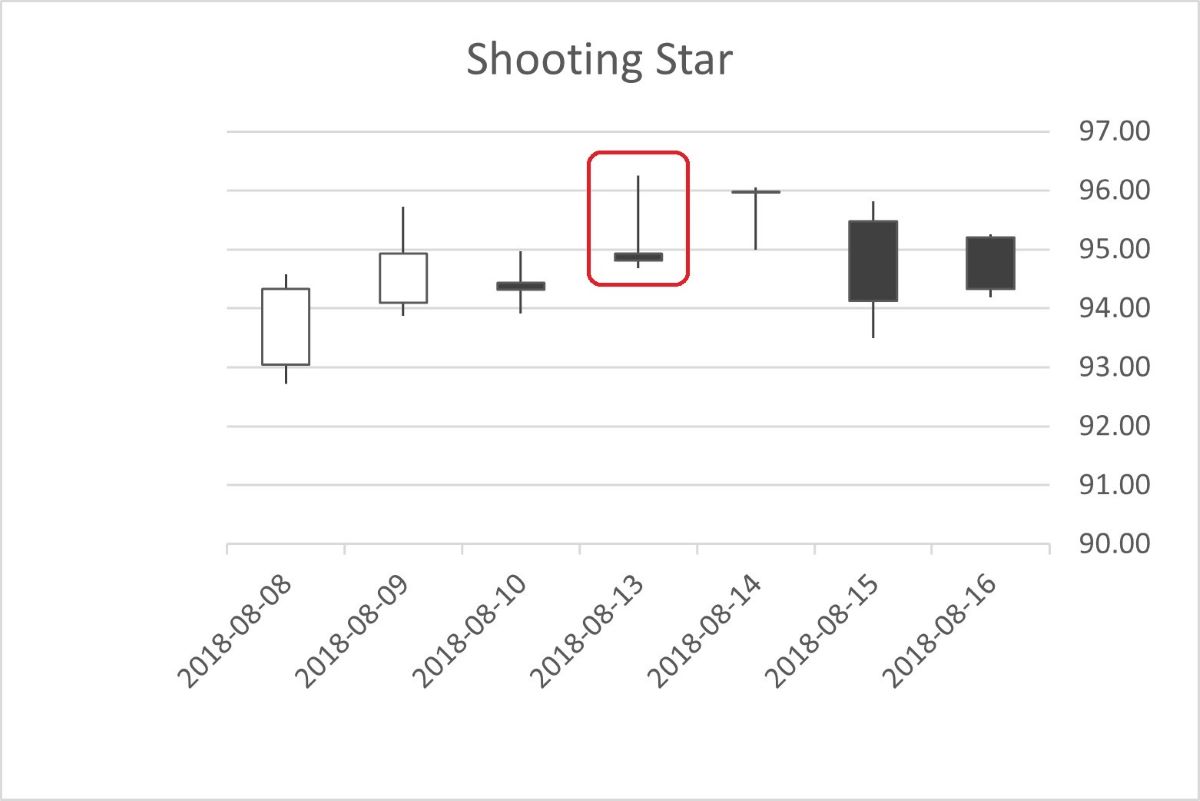
A shooting star is a bearish
reversal candlestick pattern that can appear in an uptrend. It is formed
when a stock's price opens higher than its previous close, trades higher
throughout the day, but then sells off to close near its opening price. This
results in a candlestick with a long upper shadow and a small real body near
the bottom of the trading range.
The shooting star pattern
suggests that sellers were able to overcome the buying pressure earlier in
the day and push the price down. It is often seen as a sign of a potential
trend reversal, as the bulls appear to be losing control and the bears are
gaining momentum.
Traders who spot a shooting
star pattern may look to take a short position or sell their existing long
position, in anticipation of a price drop. However, it is important to
confirm the pattern with other technical indicators and not rely solely on
the shooting star as a trading signal.
RSI stands for Relative
Strength Index, which is a technical analysis indicator used to measure the
strength and momentum of a stock's price movement. It was developed by J.
Welles Wilder Jr. in 1978.
The RSI is calculated by
comparing the average gains and losses over a specific time period. The
formula takes into account the average price gains and losses over a set
period of time and produces a value ranging from 0 to 100.
Traders and investors use
the RSI indicator to identify potential buy and sell signals for a stock.
For example, when the RSI is above 70, it may suggest that the stock is
overbought and due for a price correction, which could be a signal to sell.
Conversely, when the RSI is below 30, it may suggest that the stock is
oversold and due for a price rebound, which could be a signal to buy.
OK, now let’s blend these
ideas together to make a new strategy. The signal generation part may look
like these:
'The strategy is inside
between If and Then. If Hammer appears and RSI is lower than 30, Then
generate a Long OK signal.
If Cells(Candle, "L").Value
> Cells(Candle, "I").Value And Cells(Candle, "K").Value < Cells(Candle,
"I").Value Then
If LongOK =
False And _
(Cells(Candle, "I").Value - Cells(Candle, "K").Value) /
(Cells(Candle, "L").Value - Cells(Candle, "I").Value) > Trigger And _
(Cells(Candle, "J").Value - Cells(Candle, "L").Value) /
(Cells(Candle, "I").Value - Cells(Candle, "K").Value) < 0.1 And _
Cells(Candle, "Y").Value < 30 Then
'Strategy for Long
LongOK = True
BCBM = Candle
BBP = Round(Cells(Candle, "L").Value, 2)
Cells(Candle, "N").Value = "Long OK " & Int([B20].Value * CP /
100 / BBP) & " @ " & BBP
Exit Sub
End If
End If
If Cells(Candle, "L").Value
< Cells(Candle, "I").Value And Cells(Candle, "K").Value < Cells(Candle,
"L").Value Then
If LongOK =
False And _
(Cells(Candle, "L").Value - Cells(Candle, "K").Value) /
(Cells(Candle, "I").Value - Cells(Candle, "L").Value) > Trigger And _
(Cells(Candle, "J").Value - Cells(Candle, "I").Value) /
(Cells(Candle, "L").Value - Cells(Candle, "K").Value) < 0.1 And _
Cells(Candle, "Y").Value < 30 Then
'Strategy for Long
LongOK = True
BCBM = Candle
BBP = Round(Cells(Candle, "L").Value, 2)
Cells(Candle, "N").Value = "Long OK " & Int([B20].Value * CP /
100 / BBP) & " @ " & BBP
Exit Sub
End If
End If
'The strategy is inside
between If and Then. If Shooting Star appears and RSI is higher than 70,
Then generate a Short OK signal.
If Cells(Candle, "L").Value
< Cells(Candle, "I").Value And Cells(Candle, "J").Value > Cells(Candle,
"I").Value Then
If ShortOK =
False And _
(Cells(Candle, "J").Value - Cells(Candle, "I").Value) /
(Cells(Candle, "I").Value - Cells(Candle, "L").Value) > Trigger And _
(Cells(Candle, "L").Value - Cells(Candle, "K").Value) /
(Cells(Candle, "J").Value - Cells(Candle, "I").Value) < 0.1 And _
Cells(Candle, "Y").Value > 70 Then
'Strategy for Short
ShortOK = True
SCBM = Candle
SBP = Round(Cells(Candle, "L").Value, 2)
Cells(Candle, "N").Value = "Short OK " & Int(([B20].Value + 1.5 *
[B19].Value * SlPebP) / 1.5 * CP / 100 / SBP) & " @ " & SBP
Exit Sub
End If
End If
If Cells(Candle, "I").Value
< Cells(Candle, "L").Value And Cells(Candle, "J").Value > Cells(Candle,
"L").Value Then
If ShortOK =
False And _
(Cells(Candle, "J").Value - Cells(Candle, "L").Value) /
(Cells(Candle, "L").Value - Cells(Candle, "I").Value) > Trigger And _
(Cells(Candle, "I").Value - Cells(Candle, "K").Value) /
(Cells(Candle, "J").Value - Cells(Candle, "L").Value) < 0.1 And _
Cells(Candle, "Y").Value > 70 Then
'Strategy for Short
ShortOK = True
SCBM = Candle
SBP = Round(Cells(Candle, "L").Value, 2)
Cells(Candle, "N").Value = "Short OK " & Int(([B20].Value + 1.5 *
[B19].Value * SlPebP) / 1.5 * CP / 100 / SBP) & " @ " & SBP
Exit Sub
End If
End If
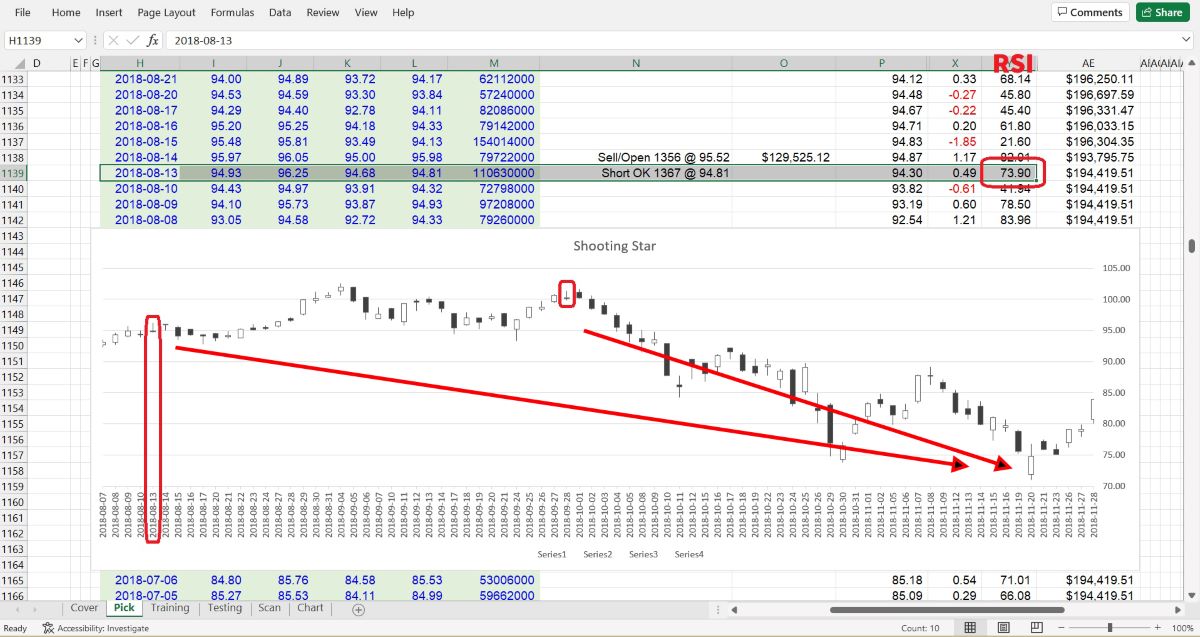
Let's run the VBA Macro to
test our new trading strategy using AMZN (Amazon.com, Inc.). The Macro will
generate a set of paper trading records on Excel worksheets that will help
us evaluate the strategy's effectiveness. When the Shooting Star pattern
appears and the RSI is higher than 70, this strategy will open Short:
Similarly, when the Hammer
candlestick appears and the RSI index value is lower than 30, the strategy
will trigger a Long position:
After scanning all parameter
combinations which ranges are set in “Scan” worksheet, we will get a curve
like this:
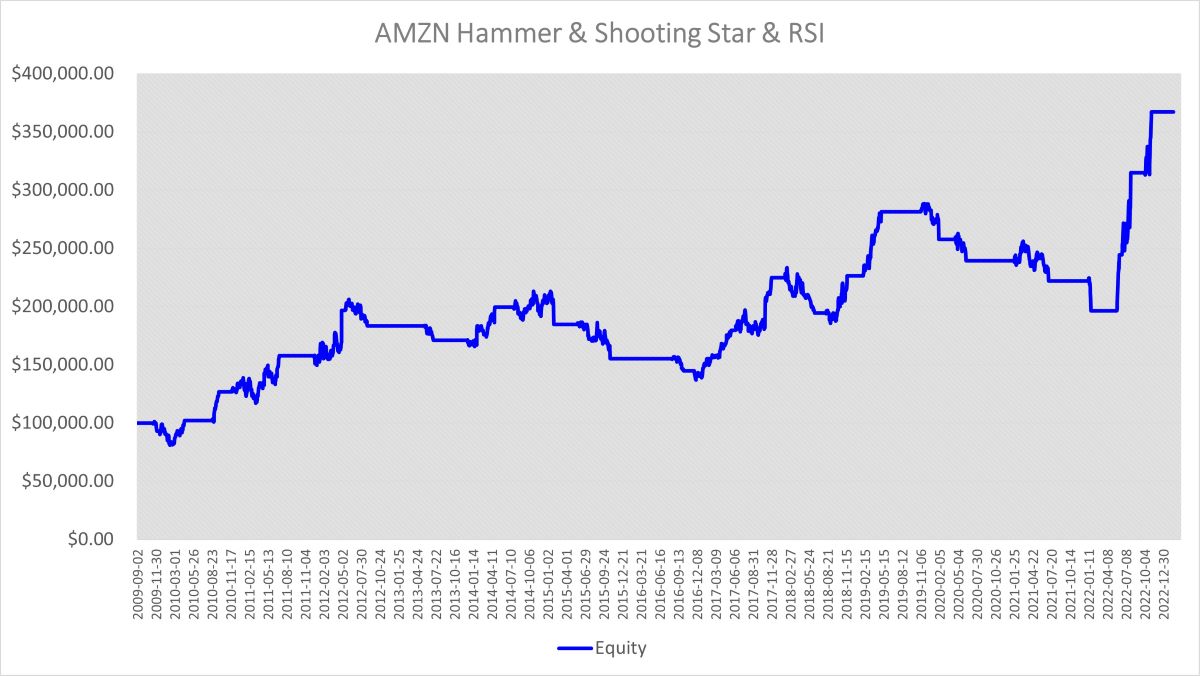
It doesn't look as
impressive as the "Three White Soldiers and Three Black Crows" strategy for
Tesla, but it still performs better than the average S&P 500 index. This
teaches us that sometimes a simple strategy can be better than a complex
one. Additionally, if we don't convert our strategy into code and run it
through backtesting, we'll never have clear visualizations to compare and
draw meaningful conclusions.
Overall, the key to
improving your stock trading strategies is to remain flexible and open to
change. By analyzing your results, identifying weaknesses, experimenting
with new ideas, keeping a trading journal, staying up-to-date, and seeking
feedback, you can continuously improve your strategies and achieve greater
success in the market.
Remember, trading is not a
sprint, it's a marathon. But beware, if you're not vigilant, you may find
yourself running in the wrong direction. Good luck with your trading, and
remember, the only thing worse than losing money in the stock market is
losing your sense of humor. Keep laughing, keep trading!
If you would like to try out
the “Hammer & Shooting Star & RSI” strategy backtesting tool, click on
Free Trial to get a 30-day free trial
demo.
LIGHTING THE PATH TO PROFITABLE TRADING
(the whole tutorial handbook pdf Free Download)
A Step-by-Step Guide to Building a Trading
Strategy Verification Tool with VBA Macros
|