Golden Cross and Death Cross Trading Strategy: Understanding the Basics
|
|
Are you ready for some trading excitement? Looking for a strategy that’s
more thrilling than a roller coaster ride? Well, buckle up, because we’re
about to dive into the world of Golden Cross and Death Cross trading
strategies! But be warned, folks, it’s not all rainbows and unicorns in the
land of trading. These strategies may sound like something out of a fantasy
novel, but they come with their own set of pros and cons that you need to be
aware of. So, grab your popcorn and get ready for a wild ride as we explore
the ups and downs of these mythical-sounding trading techniques!
Now,
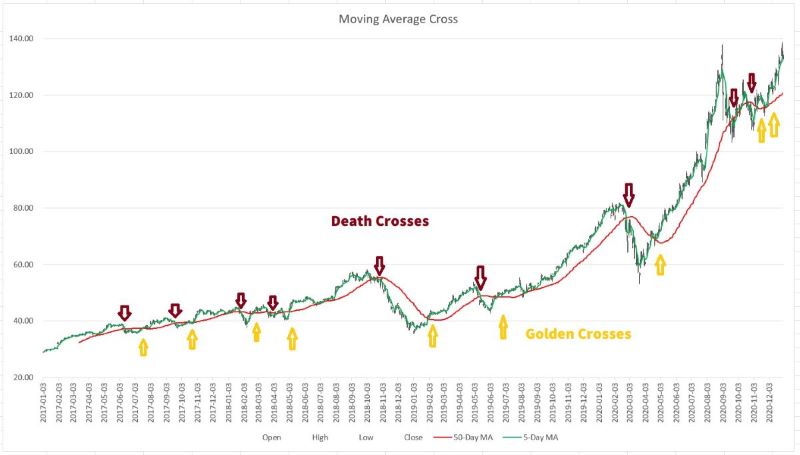
let’s start with the basics. The Golden Cross and Death Cross are two
popular technical indicators used in trading to identify potential buying or
selling opportunities. They are formed when the shorter-term moving average
(such as the 50-day moving average) crosses above or below the longer-term
moving average (such as the 200-day moving average). When the shorter-term
moving average crosses above the longer-term moving average, it’s called the
Golden Cross, which is typically seen as a bullish signal. And when the
shorter-term moving average crosses below the longer-term moving average,
it’s called the Death Cross, which is usually seen as a bearish signal.
Sounds like something straight out of a fairy tale, right?
But
before you go off chasing after these mythical crosses, let’s take a closer
look at the pros and cons of these trading strategies.
Pros of Golden Cross
and Death Cross Trading Strategies:
Easy to understand: One of the
biggest advantages of the Golden Cross and Death Cross strategies is their
simplicity. These crossovers are easy to understand and can be quickly
identified on a price chart, making them accessible to traders of all levels
of experience.
Confirmation of trend: The Golden Cross and Death
Cross can provide confirmation of a bullish or bearish trend in the market.
When the Golden Cross occurs, it can signal the start of a potential
uptrend, while the Death Cross can signal the start of a potential
downtrend, providing traders with a clear directional bias.
Time-tested: The Golden Cross and Death Cross have been used by traders for
many years and have stood the test of time. They have been observed in
various financial markets and have been considered reliable indicators by
some traders.
Cons of Golden Cross and Death Cross Trading
Strategies:
Delayed signals: One of the main drawbacks of the Golden
Cross and Death Cross strategies is that they can generate delayed signals.
These crossovers occur after the price has already made a significant move,
which means traders may miss out on the initial part of the trend.
Whipsaw signals: Ah, the dreaded whipsaw! Just like a unicorn that turns out
to be a regular horse with a horn glued on, the Golden Cross and Death Cross
can sometimes be misleading. Whipsaw signals are false signals that can
occur in these strategies, leading to false buy or sell signals during
periods of market volatility or when the price is moving in a sideways or
range-bound manner, resulting in potential losses.
Not suitable for
all markets: These magical crosses may not work equally well in all markets.
They are primarily designed for trending markets and may not be as effective
in choppy or unpredictable markets where the price moves in a random manner.
Lack of context: The Golden Cross and Death Cross do not consider other
important factors such as market fundamentals, news events, or market
sentiment. Trading decisions based solely on these crossovers may lack the
necessary context and may not capture the full picture of the market.
Risk of over-reliance: Beware of putting all your trading eggs in one
basket! Relying solely on the Golden Cross and Death Cross strategies can
lead to over-reliance on these indicators and may not take into account
other important aspects of trading, such as risk management, position
sizing, and proper trade execution. It’s important to use these strategies
in conjunction with other technical and fundamental analysis tools to make
well-informed trading decisions.
It is important to remember that the
“Crosses” pattern should not be relied on in isolation. Traders should
always conduct their own research and analysis, and consider a range of
factors before making any trades.
However, in this blog, we plan to
test a simple “Golden Cross & Death Cross” Trading Strategy solely, to get a
direct impression, without other indicators’ help or correction, how a pure
“Crosses” strategy will work?
Let’s download the “Golden Cross &
Death Cross” Trading Strategy backtesting tool from this link. It’s an Excel
Macro that’s very easy to use. For this trial, let’s pick TSLA (Tesla,
Inc.’s stock symbol) to do a back test. We’ll import TSLA’s historical data,
keeping around 2,300 days’ worth and cutting off the rest. The settings will
be as follows:
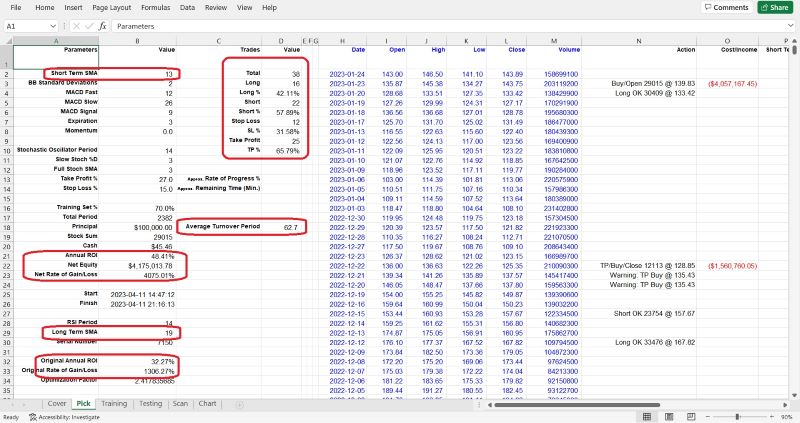
In the
“Pick” worksheet, set the Principal at cell B18 (typically set at 100,000),
and the Training % at cell B16 (normally set at 70).
Set the SMA at cell B2 (normally set at 5), and the Expiration
at cell B7 (normally set at 3).
Fill the Optimization Factor value in
cell B34. This value is specific to each stock and is calculated based on
its unique features. It influences the Trigger and Momentum used during the
backtesting VBA Macro. Users can follow us for getting the newest unique
Optimization Factor for particular stock.
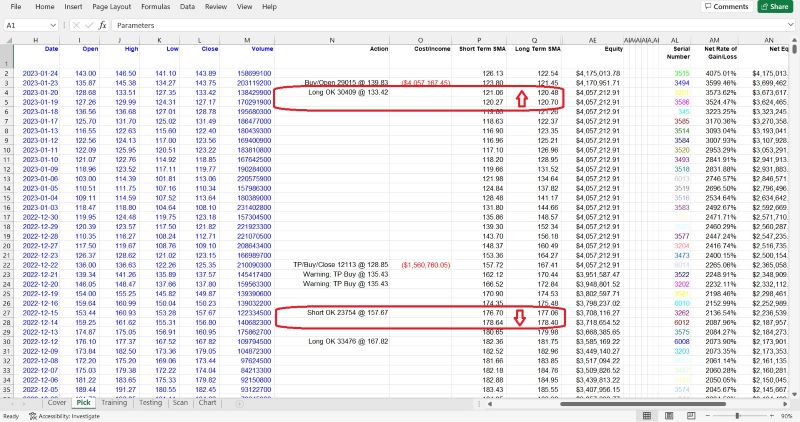
Now, let’s go to the “Scan”
worksheet, set the scan ranges for Take Profit, Stop Loss, and Momentum. The
“Scan” worksheet looks like below:
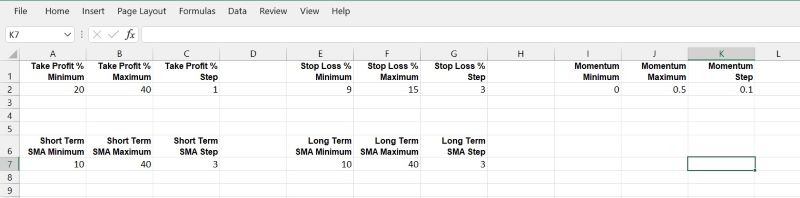
The
backtesting VBA Macro will try every combination, such as Take Profit at 3%,
Stop Loss at 12%, and Momentum (a standard to trigger the Buy or Sell
actions) at 5, etc. This tool will execute these conditions to simulate a
series of trading actions using historical data from the beginning, opening
and closing long or short positions based on the signals generated by your
trading strategies.
To run the VBA Macro program, there are several methods, for example, we
can:
1. Click on the “View” tab on the Excel ribbon.
2. Click
on the “Macros” button in the “Macros” group. This will open the “Macro”
dialog box.
3. In the “Macro” dialog box, select the Macro that you
want to run.
4. Click on the “Run” button.
We can also press
Alt + F8, the “Macro” dialog box will jump out, select the Macro, then click
the “Run” button.
The fastest method is using shortcut hot keys:
Press Ctrl + Y, the Macro will run immediately.
After running the VBA
tool, we will get a curve in “Chart” worksheet like this:
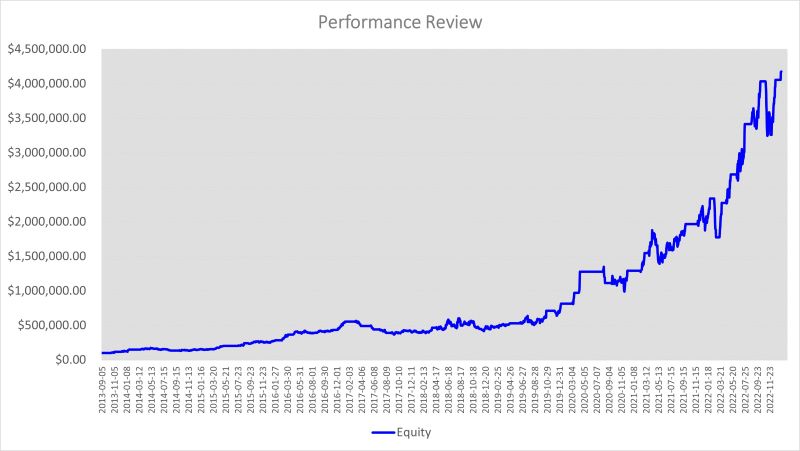
After
a long run from 2013–08–08 to 2023–01–24, spanning a total of 2382 trading
days, and with the following parameters set: Momentum at 0, Take Profit at
27%, Stop Loss at 15%, Short Term SMA at 13, Long Term SMA at 19, we
obtained an Annual ROI of 48.41%. This is significantly higher compared to
the S&P 500 Index’s average of 7%, and even surpasses the legendary investor
Warren Buffet’s average ROI of 17% per year. It almost sounds too good to be
true for this Golden Cross and Death Cross strategy under these parameter
settings. However, it’s important to remember that backtesting is based on
solid facts and numbers, as well as discipline, and the result is both
surprising and real.
During
this period, a total of 38 trade deals were completed, with 16 of them being
long positions and 22 of them being short positions. The stop loss was
triggered 12 times, while the take profit was achieved 25 times. The ratio
of stop loss vs. take profit was 65.79% vs. 31.58% (one position is not
closed yet). On average, it took 62.7 days to complete one full round of
buying and selling.
In conclusion,
the “Golden Cross & Death Cross” Trading Strategy has shown strong
performance for TSLA, with an Annual ROI of 48.41%, which is even higher
than the original value of 32.57%. However, it’s worth noting that the
transactions occurred only 38 times over a 10-year period, which may not
provide sufficient evidence to establish the strategy’s repeatability with
certainty. And it shows that this type of trading strategy is a
low-frequency trading strategy, or even a ultra-low-frequency trading
strategy, which may not be suitable for short-tempered traders lacking
patience.
So, should you embark on a quest to chase after the Golden
Cross and Death Cross in your trading endeavors? Well, like any trading
strategy, it’s important to weigh the pros and cons and carefully consider
if it aligns with your trading style, risk tolerance, and overall trading
plan. These strategies may work for some traders in certain market
conditions, but they are not a magical solution that guarantees profits.
Remember, the markets can be unpredictable and can quickly change direction,
so it’s essential to use these strategies as part of a well-rounded trading
approach.
 In conclusion, the Golden Cross and Death Cross may sound
like something out of a fairy tale, but they are real trading strategies
that have been used by traders for many years. They can provide confirmation
of trend direction and are easy to understand, but they also come with their
drawbacks, such as delayed signals, potential whipsaws, and lack of context.
It’s crucial to carefully consider the pros and cons, use them in
conjunction with other analysis tools, and practice proper risk management
to mitigate potential losses. So, keep your expectations realistic and your
trading plan well-rounded, and may your trading endeavors be filled with
more triumphs than tribulations! In conclusion, the Golden Cross and Death Cross may sound
like something out of a fairy tale, but they are real trading strategies
that have been used by traders for many years. They can provide confirmation
of trend direction and are easy to understand, but they also come with their
drawbacks, such as delayed signals, potential whipsaws, and lack of context.
It’s crucial to carefully consider the pros and cons, use them in
conjunction with other analysis tools, and practice proper risk management
to mitigate potential losses. So, keep your expectations realistic and your
trading plan well-rounded, and may your trading endeavors be filled with
more triumphs than tribulations!
And remember, in the world of
trading, it’s best to leave the fairy tales to bedtime stories and approach
your strategies with a realistic mindset. Happy trading, fellow traders! May
the Golden Cross and Death Cross be with you, but always remember to have a
solid plan, manage your risks, and stay grounded in reality. After all, as
exciting as trading can be, it’s no fairy tale!
Click
LIGHTING THE PATH TO PROFITABLE TRADING: A Step-by-Step Guide to Building a Trading Strategy Verification Tool with VBA Macros to get the whole tutorial handbook for free!
And click Free Trial to download other strategies testing tools, all for a 30-day Free Trial.
Click on Subscription to order more strategies testing tools to help your stock trading.
|


|

Free Tutorial
Share
|
|
|
|
