How does the "Hammer & Shooting Star" Trading Strategy work for Microsoft Stock?
|
|
Let’s face it — trading can be a serious business. With all the charts,
indicators, and economic news to keep track of, it’s easy to forget that
there’s a human being behind every trade. But every once in a while, a
trading strategy comes along that’s so funny it makes you forget about all
the stress and anxiety that comes with trading. So, let’s take a break from
all the seriousness and have a chuckle as we explore the “Hammer” and
“Shooting Star” trading strategies.
When it comes to trading, there
are countless strategies out there that traders can use to help them make
informed decisions and maximize their profits. One such strategy is the
“Hammer” trading strategy, which is a popular method for identifying
potential price reversals in a given market.
What is a “Hammer”?
Before we dive into the specifics of the “Hammer” trading strategy, it’s
important to first understand what a hammer is. A hammer is a type of
candlestick pattern that occurs when a security’s price opens, then falls
significantly during the trading session, but ultimately recovers most or
all of those losses by the close of the session.
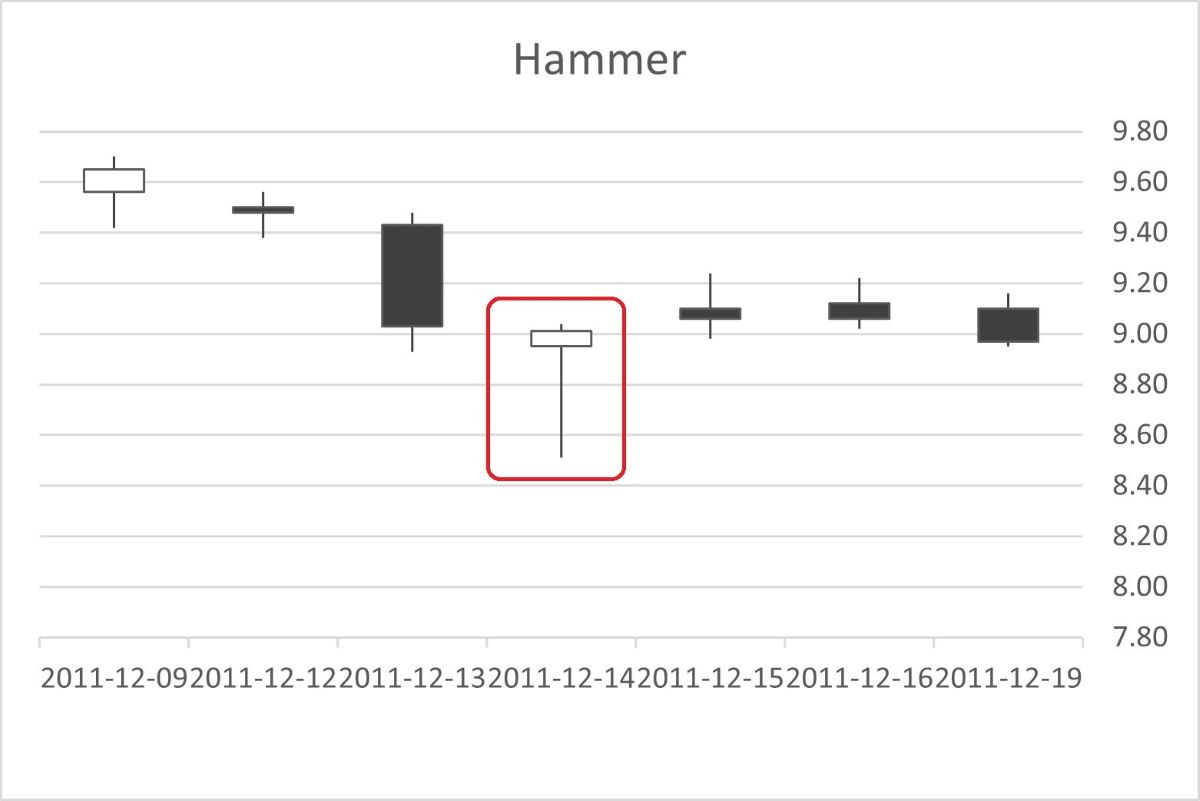
The hammer pattern gets its name from its appearance, which resembles a
hammer with a long handle and a small head. The “head” of the hammer is the
candlestick itself, which represents the difference between the opening and
closing prices, while the “handle” represents the range between the high and
low prices of the session.
Why use the hammer trading strategy?
The hammer trading strategy is based on the assumption that a hammer pattern
is a bullish signal, meaning that it suggests that the price of the security
in question is likely to rise in the near future. This is because the hammer
pattern indicates that despite early selling pressure, buyers were
ultimately able to push the price back up, suggesting that there is strong
support for the security at that price level.
When combined with
other technical indicators and analysis techniques, the hammer trading
strategy can be a powerful tool for traders looking to identify potential
entry points for long positions.
Implementing the hammer trading
strategy
To use the hammer trading strategy, traders should look for
hammer patterns on a price chart of the security they’re interested in.
Ideally, the hammer pattern should appear at the end of a downtrend, as this
is when it is most likely to signal a potential price reversal.
Once
a hammer pattern is identified, traders can then use other technical
indicators and analysis techniques to confirm their bullish outlook and
identify potential entry and exit points. Some common indicators and
techniques that traders might use in conjunction with the hammer pattern
include moving averages, trend lines, and Fibonacci retracements.
It’s worth noting that while the hammer trading strategy can be a useful
tool for identifying potential bullish opportunities, it should not be
relied on as the sole basis for making trading decisions. Traders should
always conduct their own research and analysis, and consider factors such as
market trends, news events, and economic indicators before making any
trades.
In addition to the hammer trading strategy, another
candlestick pattern that traders commonly use to identify potential price
reversals is the “Shooting Star” pattern. Like the hammer pattern, the
shooting star is a type of candlestick pattern that can indicate a potential
change in the direction of a security’s price movement.
What is a
“Shooting Star”?
A shooting star pattern is a bearish candlestick
pattern that occurs when a security’s price opens higher than the previous
day’s close, then rises significantly during the trading session before
falling back down to close near or below the opening price. The pattern gets
its name from its resemblance to a shooting star, with a long upper shadow
and a small real body.
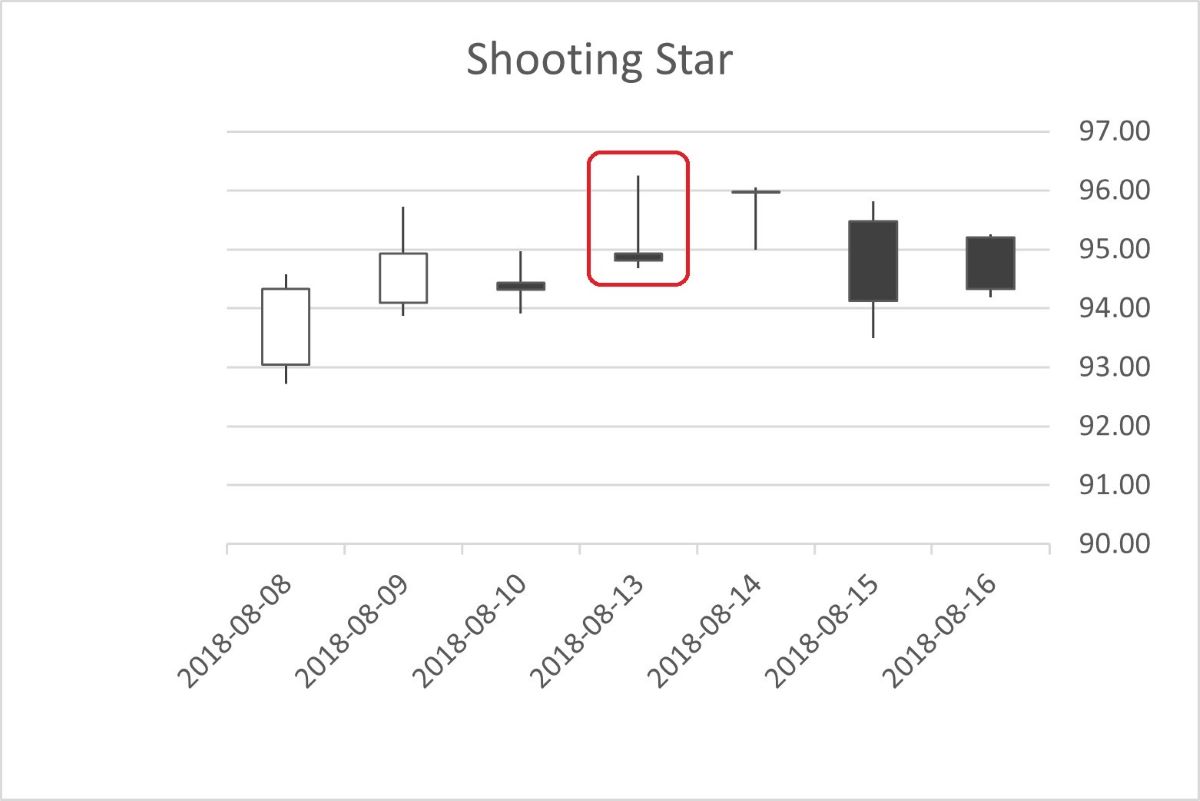
The shooting star pattern is considered a bearish signal because it
suggests that despite the initial buying pressure, sellers ultimately gained
control of the market and pushed the price down.
Using the shooting star pattern in trading
To use the shooting
star pattern in trading, traders should first look for the pattern on a
price chart of the security they’re interested in. Like the hammer pattern,
the shooting star is most useful when it appears at the end of a trend, as
this is when it is most likely to signal a potential price reversal.
Once a shooting star pattern is identified, traders can then use other
technical indicators and analysis techniques to confirm their bearish
outlook and identify potential entry and exit points. Some common indicators
and techniques that traders might use in conjunction with the shooting star
pattern include support and resistance levels, moving averages, and trend
lines.
Like the hammer trading strategy, it is important to remember
that the shooting star pattern should not be relied on in isolation. Traders
should always conduct their own research and analysis, and consider a range
of factors before making any trades.
However, in this blog, we plan
to test a simple “Hammer & Shooting Star” Trading Strategy solely, to get a
direct impression, without other indicators’ help or correction, how a pure
Hammer and Shooting Star strategy will work?
Let’s download the
‘Hammer & Shooting Star’ Trading Strategy backtesting tool from this link.
It’s an Excel Macro that’s very easy to use. For this trial, let’s pick MSFT
(Microsoft Corporation’s stock symbol). We’ll import MSFT’s historical data,
keeping around 3,000 days’ worth and cutting off the rest. The settings will
be as follows:
In the “Pick” worksheet, set the Principal at cell B18
(typically set at 100,000), and the Training % at cell B16 (normally set at
70).
Set the SMA at cell B2 (normally set at 5), and the Expiration
at cell B7 (normally set at 3).
Fill the Optimization Factor value in
cell B34. This value is specific to each stock and is calculated based on
its unique features. It influences the Trigger and Momentum used during the
backtesting VBA Macro. Users can follow us for getting the newest unique
Optimization Factor for particular stock.
Now, let’s go to the “Scan”
worksheet, set the scan ranges for Take Profit, Stop Loss, and Momentum. The
“Scan” worksheet looks like below:

The
backtesting VBA Macro will try every combination, such as Take Profit at 3%,
Stop Loss at 12%, and Momentum (a standard to trigger the Buy or Sell
actions) at 5, etc. This tool will execute these conditions to simulate a
series of trading actions using historical data from the beginning, opening
and closing long or short positions based on the signals generated by your
trading strategies.
To run the VBA Macro program, there are several methods, for example, we
can:
1. Click on the “View” tab on the Excel ribbon.
2. Click
on the “Macros” button in the “Macros” group. This will open the “Macro”
dialog box.
3. In the “Macro” dialog box, select the Macro that you
want to run.
4. Click on the “Run” button.
We can also press
Alt + F8, the “Macro” dialog box will jump out, select the Macro (the name
in this demo is “Hammer_ShootingStar” and its version number), then click
the “Run” button.
The fastest method is using shortcut hot keys:
Press Ctrl + Y, the Macro will run immediately.
After running the VBA
tool, we will get a curve in “Chart” worksheet like this:

After
a long run, since 2011–01–03 to 2023–03–14, which is a total of 3069 trading
days, and with the following parameters set: Momentum at 2, Take Profit at
24%, Stop Loss at 12%, we will get an Annual ROI at 16.28%, compared to S&P
500 Index’s average of 7%, not bad, eh? During this period, there were 16
trade deals completed, with 11 of them being long positions and 5 of them
being short positions. Stop loss was triggered 5 times, while take profit
was achieved 11 times. The ratio of stop loss vs. take profit was 68.75% vs.
31.25%. On average, it took 191.8 days to complete one full round of buying
and selling.

In
conclusion, the ‘Hammer & Shooting Star’ Trading Strategy works okay for
MSFT. However, the transactions (which occurred 16 times over a 12-year
period) are too few to provide strong evidence of the strategy’s
repeatability.
 While the hammer and shooting star trading
strategies may sound like they belong in a hardware store or a sci-fi movie,
they’re actually powerful tools that traders can use to make informed
decisions. But let’s not forget to have some fun along the way — after all,
life is too short to take everything so seriously. So, go ahead and
incorporate the hammer and shooting star into your trading strategy, but
don’t forget to take a break and laugh at the occasional “hammer time” or
“shooting star” joke. Happy trading, and may the laughter be with you! While the hammer and shooting star trading
strategies may sound like they belong in a hardware store or a sci-fi movie,
they’re actually powerful tools that traders can use to make informed
decisions. But let’s not forget to have some fun along the way — after all,
life is too short to take everything so seriously. So, go ahead and
incorporate the hammer and shooting star into your trading strategy, but
don’t forget to take a break and laugh at the occasional “hammer time” or
“shooting star” joke. Happy trading, and may the laughter be with you!
Click
LIGHTING THE PATH TO PROFITABLE TRADING: A Step-by-Step Guide to Building a Trading Strategy Verification Tool with VBA Macros to get the whole tutorial handbook for free!
And click Free Trial to download other strategies testing tools, all for a 30-day Free Trial.
Click on Subscription to order more strategies testing tools to help your stock trading.
|


|

Free Tutorial
Share
|
|
|
|
