MACD Indicator: Adding Some Swagger to Your Trading Strategy
|
|
Are you tired of using boring technical indicators that put you to sleep
faster than your uncle’s stories at Thanksgiving dinner? Look no further
than the MACD indicator! This little guy might just be the life of the party
in your trading strategy. Okay, maybe not quite, but it can certainly add
some pizzazz to your analysis. Let’s dive in and see what all the fuss is
about!
The MACD (Moving Average Convergence Divergence) indicator is
a popular technical analysis tool used by traders to identify potential
trend reversals and momentum shifts in financial markets. It was developed
by Gerald Appel in the late 1970s, and it remains one of the most widely
used indicators today.
The MACD indicator is composed of three
components: the MACD line, the signal line, and the histogram. The MACD line
is the difference between two exponential moving averages (EMAs) of
different time periods, usually 12 and 26 periods. The signal line is a
9-period EMA of the MACD line, and the histogram represents the difference
between the MACD line and the signal line.
When the MACD line crosses
above the signal line, it is considered a bullish signal, indicating that
momentum is shifting to the upside. Conversely, when the MACD line crosses
below the signal line, it is a bearish signal, indicating that momentum is
shifting to the downside. The histogram can also be used to confirm these
signals, with positive values indicating bullish momentum and negative
values indicating bearish momentum.
Traders can use the MACD
indicator in a variety of ways. Some use it as a standalone indicator, while
others use it in combination with other technical analysis tools such as
support and resistance levels, trendlines, and chart patterns. One popular
strategy is to look for divergences between the MACD indicator and price
action. For example, if price is making lower lows while the MACD is making
higher lows, it may indicate that a trend reversal is imminent.
Another way to use the MACD is to look for crossovers between the MACD line
and the signal line. For example, a bullish crossover occurs when the MACD
line crosses above the signal line, indicating a potential uptrend. Traders
may enter a long position at this point and exit when the MACD line crosses
back below the signal line.
It’s worth noting that while the MACD
indicator can be a useful tool for identifying potential trading
opportunities, it should not be relied on as the sole basis for making
trading decisions. Traders should always conduct their own research and
analysis, and consider factors such as market trends, news events, and
economic indicators before making any trades.
However, in this blog,
we plan to test a simple “MACD” Trading Strategy exclusively, to get a
direct impression, without any help or correction from other indicators,
about the effectiveness of a pure MACD strategy.
Let’s download the
“MACD” Trading Strategy backtesting tool from this link. It’s an Excel Macro
that’s very easy to use. For this trial, let’s pick NVDA (Nvidia
Corporation’s stock symbol). We’ll import NVDA’s historical data, keeping
around 3,000 days’ worth and removing the remaining. The settings will be as
follows:
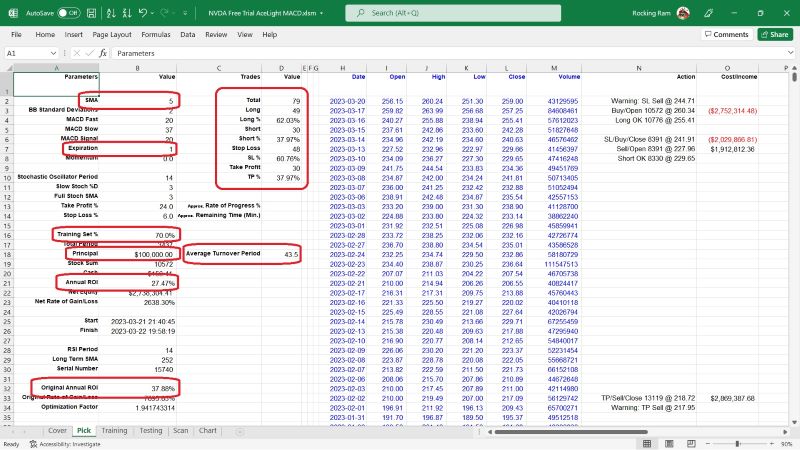
In the “Pick” worksheet, set the Principal at cell B18
(typically set at 100,000), and the Training % at cell B16 (normally set at
70).
Set the SMA at cell B2 (normally set at 5), and the Expiration
at cell B7 (normally set at 3; this time, we’ll try 1).
Fill the
Optimization Factor value in cell B34. This value is specific to each stock
and is calculated based on its unique features. It influences the Trigger
and Momentum used during the backtesting VBA Macro. Users can follow us for
getting the newest unique Optimization Factor for particular stock.
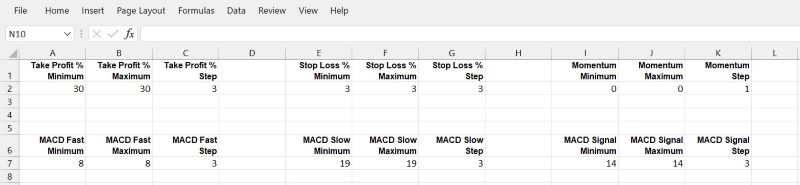
Now, let’s go to the “Scan” worksheet, set the scan ranges for Take Profit,
Stop Loss, omentum, MACD Fast, Slow and Signal. The “Scan” worksheet looks
like below:
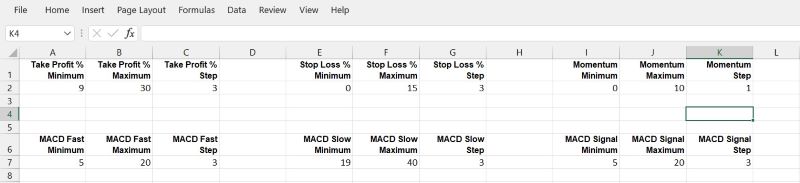
The backtesting VBA Macro will try every combination, such as Take
Profit at 3%, Stop Loss at 12%, and Momentum (a standard to trigger the Buy
or Sell actions) at 5, etc. This tool will execute these conditions to
simulate a series of trading actions using historical data from the
beginning, opening and closing long or short positions based on the signals
generated by your trading strategies.
To run the VBA Macro program,
there are several methods, for example, we can:
1. Click on the
“View” tab on the Excel ribbon.
2. Click on the “Macros” button in
the “Macros” group. This will open the “Macro” dialog box.
3. In the
“Macro” dialog box, select the Macro that you want to run.
4. Click
on the “Run” button.
We can also press Alt + F8, the “Macro” dialog
box will jump out, select the Macro (the name in this demo is “MACD” and its
version number), then click the “Run” button.
The fastest method is
using shortcut hot keys: Press Ctrl + Y, the Macro will run immediately.
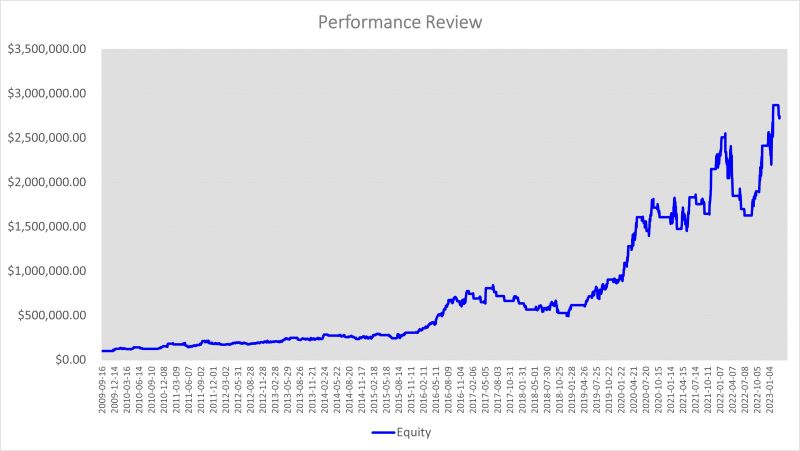
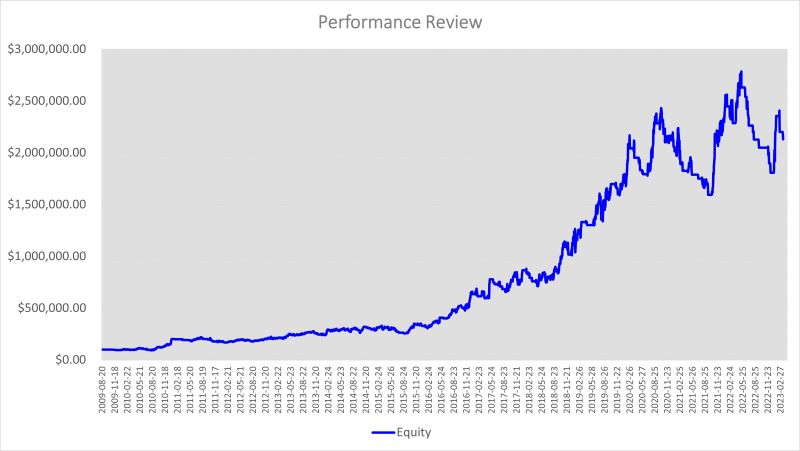
After running the VBA tool, we will get a curve in “Chart” worksheet
like this:
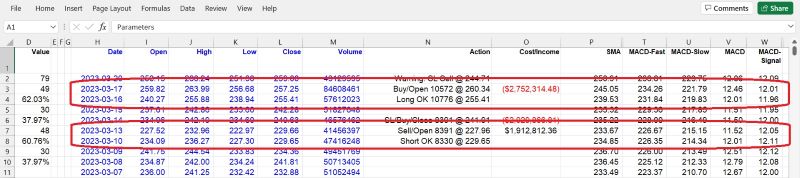
And we can see, when the MACD is crossing up and higher than MACD
Signal, the VBA Macro generates a Long OK signal, and Buy to open Long in 1
day; when the MACD is crossing down and lower than MACD Signal, the VBA
program gives a Short OK signal, then Sell to open short in 1day. If we set
the Expiration (“Pick” worksheet cell B7) as 3, the signals will expire
after 3 days.
After a
long run, since 2009–07–24 to 2023–03–20, which is a total of 3437 trading
days, and with the following parameters set: Momentum at 0, Take Profit at
24%, Stop Loss at 6%, MACD Fast at 20, MACD Slow at 37, MACD Signal at 20,
we will get an Annual ROI at 27.47%, compared to S&P 500 Index’s average of
7%, it sounds impressive, eh?
During this period, there were 79 trade
deals completed, with 49 of them being long positions and 30 of them being
short positions. Stop loss was triggered 48 times, while take profit was
achieved 30 times, 1 position is not closed yet. The ratio of stop loss vs.
take profit was 38% vs. 61% (because Take Profit at 24% and Stop Loss at 6%,
one Take-Profit will cover 4 Stop-Loss). On average, it took 43.5 days to
complete one full round of buying and selling.
In
conclusion, the MACD Trading Strategy works well for NVDA. However, the
transactions (which occurred 79 times over a 13-year period) are relatively
few to provide strong evidence of the strategy’s repeatability.
We
can try another parameter group like this:
Then we
can get this result:
Still
good enough, eh? Take a look at the Average Turnover Period:
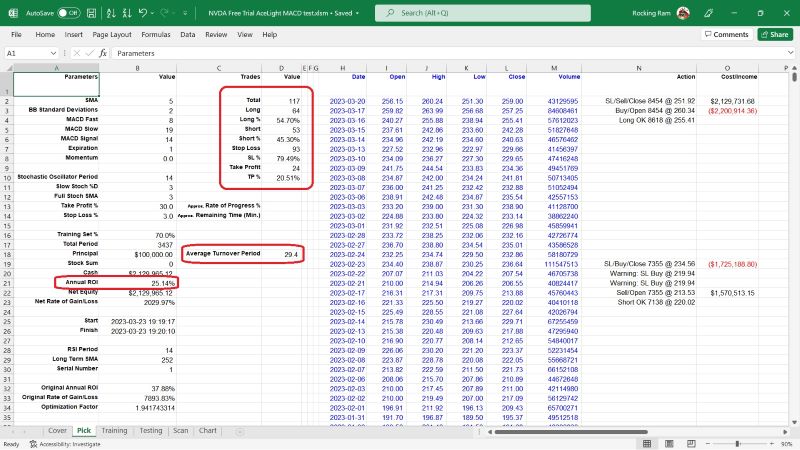
The
transactions (which occurred 117 times over a 13-year period) are sufficient
to provide strong evidence of the strategy’s repeatability. If this
indicator shows such quality while working solely, it is qualified to be one
part of materials in a trading strategy that integrates other indicators or
patterns of the same quality, and has the potential to be combined with
other good indicators or patterns to create a stronger trading strategy.
Some traders complain that MACD does not work well for them. There could
be many reasons for this failure, but one of the reasons could be that they
did not do the backtesting correctly, especially if they did not find the
right parameter combinations or settings. Do you remember the default
parameters of MACD? They are MACD Fast at 12, Slow at 26, and Signal at 9,
right? We tried these default settings to backtest the MACD, using the same
data of NVDA, and got a sad result: no matter how the Take Profit, Stop
Loss, and Momentum were set, the typical 12–26–9 MACD setting failed.
This result explains why some traders dislike the MACD indicator.
Actually, they do not know that it is not the MACD’s fault, but rather a
problem with the parameter settings. If they had known how to adjust the
parameter settings earlier, they might have discovered a “gold mine”. In
short, backtesting is crucial, and a backtesting tool can be very helpful.
Sometimes it can make the difference between life and death. If you still do
not have a backtesting tool to verify trading strategies and find the
correct settings for your favorite indicators, get one now. You must be glad
when you have a good tool on hand and your competitors don’t even know there
are such cool things in the world.
 Overall, the MACD indicator is a
powerful tool for identifying potential trend reversals and momentum shifts
in financial markets. However, it is important to note that no indicator is
foolproof, and traders should always use proper risk management techniques
to protect their capital. Overall, the MACD indicator is a
powerful tool for identifying potential trend reversals and momentum shifts
in financial markets. However, it is important to note that no indicator is
foolproof, and traders should always use proper risk management techniques
to protect their capital.
So, there you have it folks, the MACD
indicator: the one tool that won’t make you want to take a nap during your
trading sessions. Sure, it may not be as exciting as a clown juggling
flaming swords, but it can certainly add some excitement to your chart
analysis. So, go forth and conquer the markets with the MACD, and may your
trades be as profitable as a used car salesman on a hot summer day. Happy
trading!
Click
LIGHTING THE PATH TO PROFITABLE TRADING: A Step-by-Step Guide to Building a Trading Strategy Verification Tool with VBA Macros to get the whole tutorial handbook for free!
And click Free Trial to download other strategies testing tools, all for a 30-day Free Trial.
Click on Subscription to order more strategies testing tools to help your stock trading.
|


|

Free Tutorial
Share
|
|
|
|
