How to use RSI indicator to trade stocks: Backtesting results for Google stock
|
|
Are you tired of the same old boring technical indicators? Do you find
yourself falling asleep at your desk while staring at charts? Fear not, my
fellow traders, for I have a solution that will not only wake you up but
also put a smile on your face. Let me introduce you to the Relative Strength
Index, or as I like to call it, the Really Simple Indicator. Don’t let the
name fool you; this little guy may be simple, but it’s also mighty. So
buckle up, my friends, and get ready to add a little laughter to your
trading strategy with the RSI.
The Relative Strength Index (RSI) is a
popular technical indicator used by traders to identify potential buy and
sell signals in stocks. It measures the strength of a stock’s recent price
movements and helps traders determine if a stock is overbought or oversold.
In this blog, we will discuss how to use the RSI indicator to trade stocks
effectively.
What is the RSI Indicator? The RSI is a momentum
oscillator that measures the strength of a stock’s recent price movements.
The indicator oscillates between 0 and 100 and is calculated based on the
average gain and loss of the stock over a specific period. The RSI is
typically calculated using a 14-day period, but it can be adjusted based on
the trader’s preference.
How to Use the RSI Indicator to Trade
Stocks: The RSI indicator can be used in several ways to identify potential
buy and sell signals in stocks. Here are a few common strategies:
Overbought and Oversold Conditions: The RSI is often used to identify
overbought and oversold conditions in a stock. When the RSI is above 70, the
stock is considered overbought, and when the RSI is below 30, the stock is
considered oversold. Traders can use these levels as potential sell and buy
signals, respectively.
Divergence: Divergence occurs when the stock’s
price is moving in the opposite direction of the RSI. This can be a
potential signal that the current trend is losing momentum and a reversal is
likely to occur. Traders can use divergence as a potential signal to exit or
enter a position.
Trendline Analysis: Traders can use trendlines to
identify potential buy and sell signals. When the RSI breaks above a
downtrend line, it can be a signal to buy the stock. Conversely, when the
RSI breaks below an uptrend line, it can be a signal to sell the stock.
Bullish and Bearish Divergence: When the stock’s price is making lower
lows, and the RSI is making higher lows, it is called bullish divergence.
This can be a potential signal that the stock is likely to reverse and move
higher. Conversely, when the stock’s price is making higher highs, and the
RSI is making lower highs, it is called bearish divergence. This can be a
potential signal that the stock is likely to reverse and move lower.
Moving Average Crossover: Traders can use the RSI in combination with a
moving average crossover to identify potential buy and sell signals. When
the RSI crosses above the moving average, it can be a signal to buy the
stock. Conversely, when the RSI crosses below the moving average, it can be
a signal to sell the stock.
Today we like to test the pure RSI
indicator’s power. Let’s pick GOOG (Google LLC’s stock symbol) to be the
target. Based on a simple trading strategy: When the RSI is below 30, we buy
and open a Long position. When the RSI is above, we sell to open a Short
position.
We can download the ‘RSI’ Trading Strategy backtesting tool
from the TYZU website. It’s an Excel Macro that’s very easy to use, and
offers a 30-day free trial. For this backtesting, we’ll import GOOG’s
historical data, keeping around 3,000 days’ worth and cutting off the rest.
The settings will be as follows:
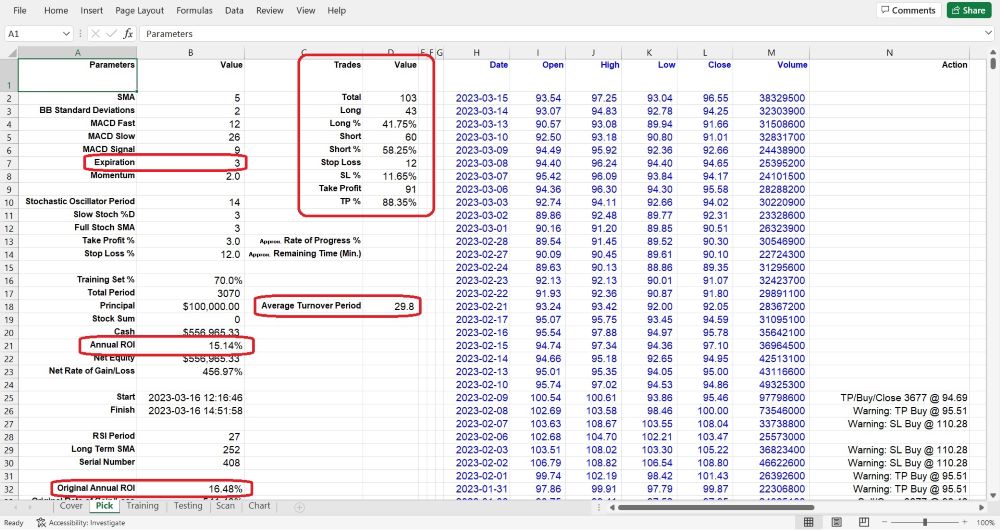
In the “Pick” worksheet, set
the Principal at cell B18 (typically set at 100,000), and the Training % at
cell B16 (normally set at 70).
Set the SMA at cell B2 (normally set
at 5), and the Expiration at cell B7 (normally set at 3).
Fill the
Optimization Factor value in cell B34. This value is specific to each stock
and is calculated based on its unique features. It influences the Trigger
and Momentum used during the backtesting VBA Macro. Users can follow us for
getting the newest unique Optimization Factor for particular stock.
Now, let’s go to the “Scan” worksheet, set the scan ranges for Take Profit,
Stop Loss, Momentum, and RSI. The “Scan” worksheet looks like below:
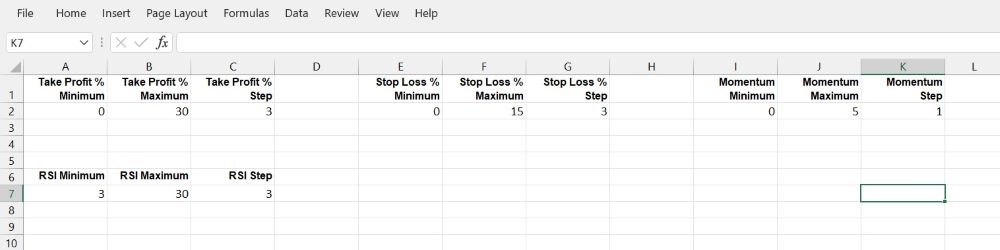
The
backtesting VBA Macro will try every combination, such as Take Profit at 3%,
Stop Loss at 12%, and Momentum (a standard to trigger the Buy or Sell
actions) at 5, etc. This tool will execute these conditions to simulate a
series of trading actions using historical data from the beginning, opening
and closing long or short positions based on the signals generated by your
trading strategies.
To run the VBA Macro program, there are several
methods, for example, we can:
1. Click on the “View” tab on the Excel
ribbon.
2. Click on the “Macros” button in the “Macros” group. This
will open the “Macro” dialog box.
3. In the “Macro” dialog box,
select the Macro that you want to run.
4. Click on the “Run” button.
We can also press Alt + F8, the “Macro” dialog box will jump out, select
the Macro (the name in this demo is “RSI” and its version number), then
click the “Run” button.
The fastest method is using shortcut hot
keys: Press Ctrl + Y, the Macro will run immediately.
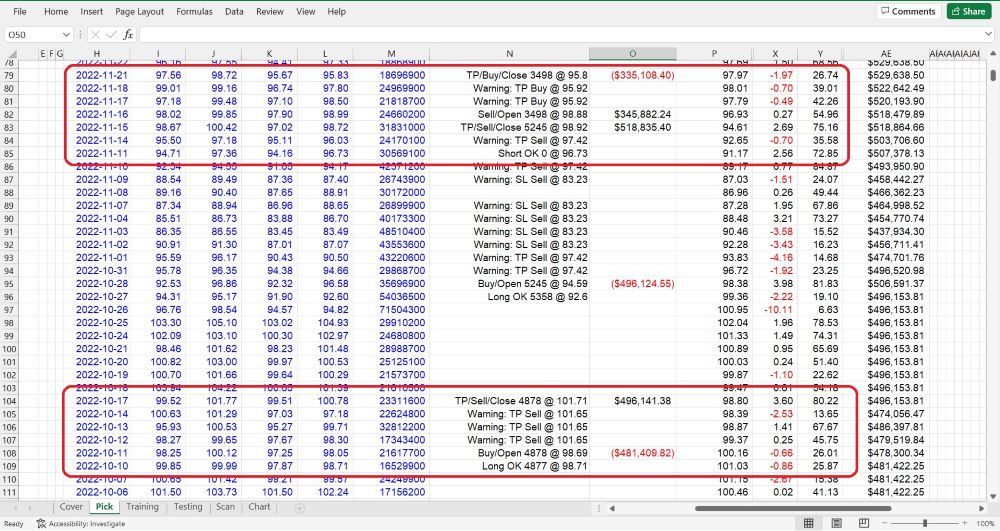
When the VBA
tool finishes scanning, we will get a curve in “Chart” worksheet like this:
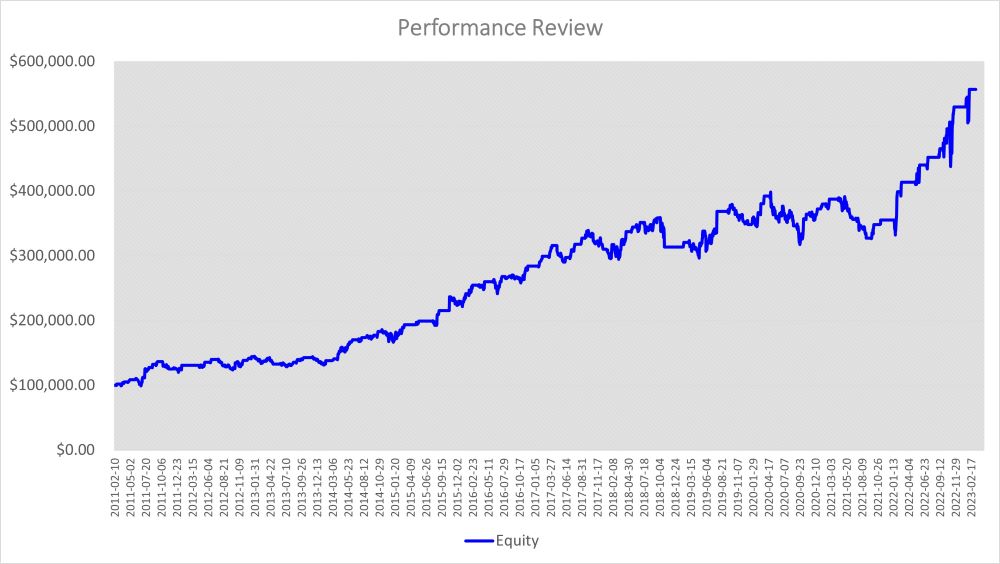
And we can see, when the RSI is below 30, the VBA Macro generates a Long OK
signal, and Buy to open Long within three days; when the RSI is above 70,
the VBA program gives a Short OK signal, then Sell to open short within
three days. If we set the Expiration (“Pick” worksheet cell B7) as 1, the
signals will expire after 1 day.
After
a long run, since 2011–01–03 to 2023–03–15, which is a total of 3070 trading
days, and with the following parameters set: Momentum at 2, Take Profit at
3%, Stop Loss at 12%, RSI at 27, we will get an Annual ROI at 15.14%,
compared to S&P 500 Index’s average of 6%~7%, not bad, eh? During this
period, there were 103 trade deals completed, with 43 of them being long
positions and 60 of them being short positions. Stop loss was triggered 12
times, while take profit was achieved 91 times. The ratio of stop loss vs.
take profit was 88.35% vs. 11.65%. On average, it took 29.8 days to complete
one full round of buying, selling, holding, and empty position waiting.
In conclusion, the “RSI” Trading Strategy works okay for GOOG. The
transactions (which occurred 103 times over a 12-year period) are good
enough to provide strong evidence of the strategy’s repeatability. If this
indicator shows such quality while working solely, it is qualified to be one
part of materials in a trading strategy that integrates other indicators or
patterns of the same quality, and has the potential to be combined with
other good indicators or patterns to create a stronger trading strategy.
 And there you have it, folks — the RSI, the Really Simple Indicator. Who
knew something so simple could be so effective? Just remember, while the RSI
may be easy to use, trading is still a risky business. So don’t go all-in on
a trade just because the RSI says so, unless you’re looking for a one-way
ticket to the poorhouse. Keep calm, trade on, and may the RSI be with you.
And if all else fails, you can always blame your losses on the indicator
being too darn simple. Happy trading! And there you have it, folks — the RSI, the Really Simple Indicator. Who
knew something so simple could be so effective? Just remember, while the RSI
may be easy to use, trading is still a risky business. So don’t go all-in on
a trade just because the RSI says so, unless you’re looking for a one-way
ticket to the poorhouse. Keep calm, trade on, and may the RSI be with you.
And if all else fails, you can always blame your losses on the indicator
being too darn simple. Happy trading!
Click
LIGHTING THE PATH TO PROFITABLE TRADING: A Step-by-Step Guide to Building a Trading Strategy Verification Tool with VBA Macros to get the whole tutorial handbook for free!
And click Free Trial to download other strategies testing tools, all for a 30-day Free Trial.
Click on Subscription to order more strategies testing tools to help your stock trading.
|


|

Free Tutorial
Share
|
|
|
|
