|
To create a trading
strategy, you need to identify a set of rules that will determine when to
enter and exit trades. In this chapter, we will cover some basic trading
strategies and show you how to implement them in Excel using formulas and
VBA.
For example, have you ever
heard of the “Three White Soldiers” and “Three Black Crows” stock
candlestick patterns? Let’s take a look at this chart:
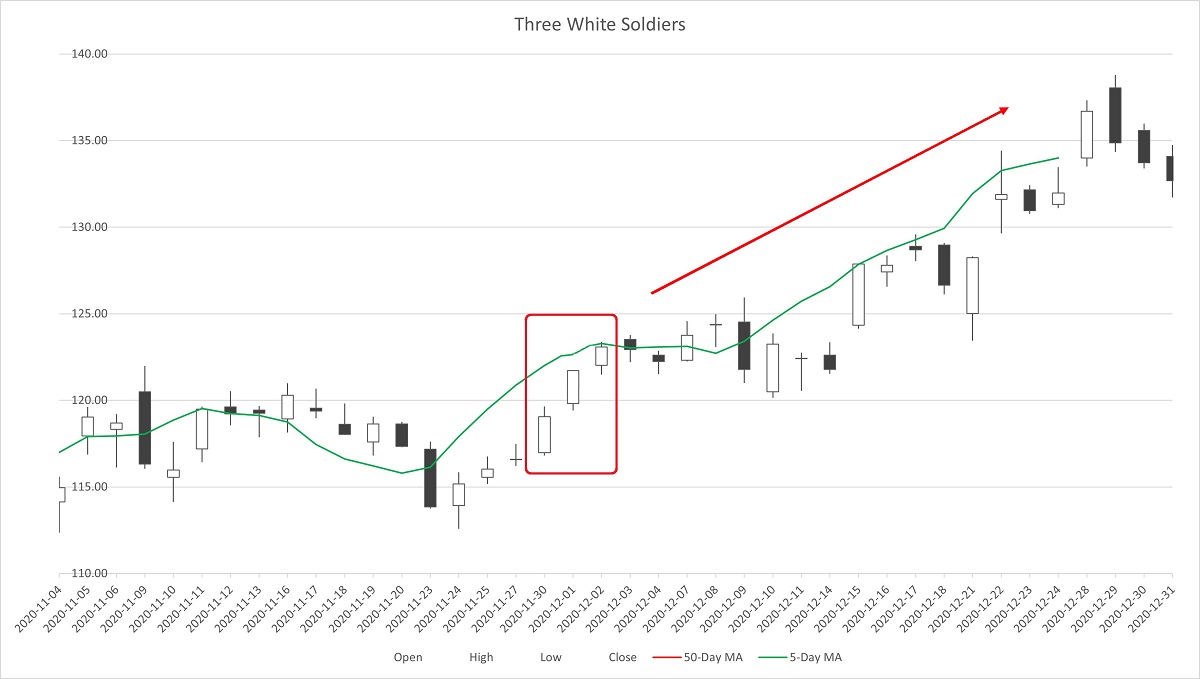
This is the so-call "Three
White Soldiers". It is a bullish candlestick pattern that typically
indicates a strong uptrend in the stock price. It consists of three long
white (or green) candles, each with small or no shadows, that open higher
and close higher than the previous day's candle.
The pattern is called "Three
White Soldiers" because the three candles resemble three soldiers marching
in a row. It is a sign of strong buying pressure and suggests that the bulls
are in control of the market. Traders often look for this pattern to
identify potential entry points for long positions, but it should be
confirmed with other technical indicators before making any trading
decisions.
Now, here we have another
pattern:
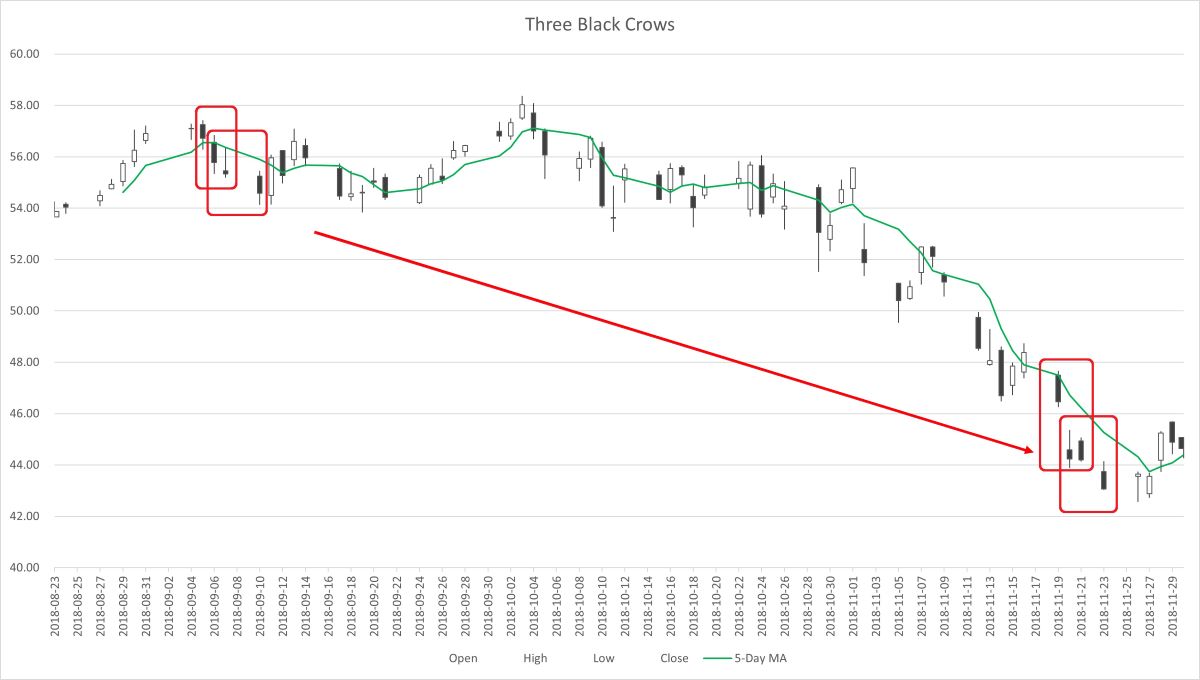
Let’s say hello to the
"Three Black Crows". It is a bearish candlestick pattern that is typically
seen at the end of an uptrend in the stock price. It consists of three long
black (or red) candles, each with small or no shadows, that open lower and
close lower than the previous day's candle.
The pattern is called "Three
Black Crows" because the three candles resemble three crows sitting in a
row. It is a sign of strong selling pressure and suggests that the bears are
in control of the market. Traders often look for this pattern to identify
potential entry points for short positions, but it should be confirmed with
other technical indicators before making any trading decisions.
According to these ideas, we
can develop a trading strategy to buy stocks while we see the Three White
Soldiers appearing, and short sell the stocks when we find the Three Black
Crows sitting there.
Now we start to write a VBA
Macro, a simple program to execute this strategy. To write a VBA macro,
follow these steps:
1.
Open Microsoft Excel.
2.
Press Alt+F11 to open the
Visual Basic Editor.
3.
In the Visual Basic Editor,
select the workbook in which you want to create the Macro.
4.
Click on the Insert menu and
select Module. This will create a new module for the Macro.
5.
In the module, type the code
for the Macro. The code should be written in the VBA programming language.
6.
Save the Macro by clicking
on the Save button or by pressing Ctrl+S.
7.
Close the Visual Basic
Editor.
8.
To run the Macro, open the
workbook in which it was created and press Alt+F8 to open the Macros dialog
box.
9.
Select the Macro you want to
run and click the Run button.
Note: It is important to
test the Macro thoroughly before using it on important data. Also, make sure
to enable Macros in Excel before running the Macro.
Before starting to do this
VBA coding, we need a plan. It looks like the programming flowchart below:
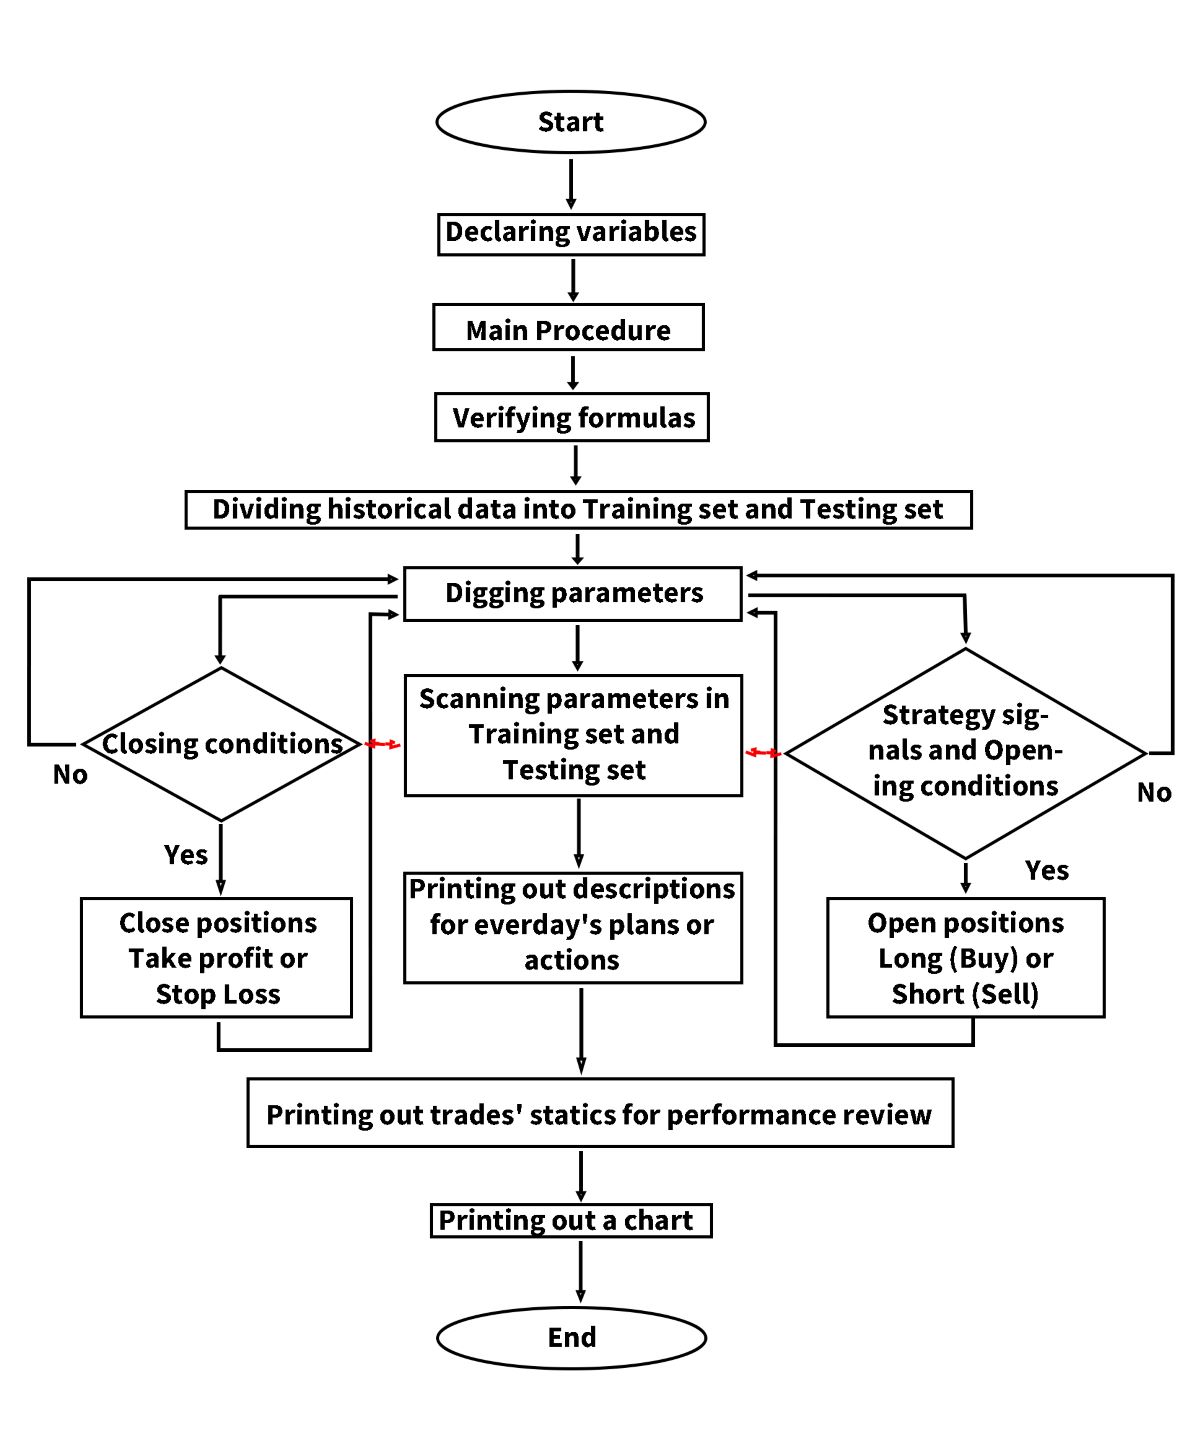
First of all, we need to
declare variables. Declaring variables in VBA is important because it helps
to allocate memory to store the data that the variable will hold. This
allows the program to use the variable efficiently and effectively.
By declaring variables, you
can also specify the data type of the variable (such as integer, string, or
boolean), which ensures that the variable is used correctly throughout the
program. If you don't declare a variable, VBA will assume a data type based
on the value assigned to the variable, which can cause errors or unexpected
results.
Declaring variables also
makes the code more readable and easier to understand, as it makes it clear
what each variable represents and how it will be used.
In the Main Procedure, we will turn
off Automatic Calculation to speed up VBA. Use
Application.Calculation = xlCalculationManual at the beginning of the
code, and turn it on again at the end with Application.Calculation =
xlCalculationAutomatic.
Then we do some
initialization, and call four subroutines, each implementing a different
function.
Call Self_Verifying
'Verifying formulas
Call Digging ‘Digging parameters
Call Scanning 'Scanning parameters in Training set and Testing set
Call EquityChart
'Printing out a chart to evaluate the result
In the Self-Verifying
procedure, we will verify all formulas used in every Excel worksheet, such
as calculating moving average value, indicator value, stock position, cash,
equity, etc. These formulas have been set into the demo Excel files. To
prevent them from being ruined or damaged accidentally, every time the VBA
Macro is run, the program will verify all formulas automatically to ensure
that the results and output are correct and fit the same standards.
In the Digging procedure, we
will dig through every parameter combination to simulate opening and closing
positions, calculate the profit or loss, compare ROI, eliminate
low-performance parameters, and select profitable combinations.
For digging out good
parameter combinations, we want to borrow some ideas from Machine Learning
technology (very fashionable, eh?), to divide historical data into two
parts, test our Trading Strategy (or we can use another word, “Model”, in
Machine Learning) under different conditions.
In machine learning, the
data is often divided into two subsets: the training set and the testing
set. The training set is used to train the machine learning model, while the
testing set is used to evaluate the performance of the trained model.
The purpose of dividing the
data into training and testing sets is to avoid overfitting, which is a
situation where the model performs very well on the training data but poorly
on new, unseen data. By evaluating the model's performance on the testing
set, we can get an estimate of how well the model will perform on new,
unseen data. For stock trading, it means: based on the training set’s
performance, we can select some strong parameters to test in the testing
set, screen out and throw out the weak ones which will lead us to failure
and loss, those survivors will give us a likelihood to estimate how
profitable the strategy will perform in the future.
The historical data can be
divided into training and testing sets, with a typical split of 70% for
training and 30% for testing. In our Demo Excel files, the default split is
70% for Training set and 30% for Testing set. Users can adjust them to 60%
or 80% for training and 40% or 20% for testing. Be careful, the split ratio
could affect the final results significantly.
The most important part in Digging procedure is the trading strategy conditions. We have a subroutine named as Signals to take charge of comparing the opening conditions. For example, we can Call Signals() to generate the simplest "Three White Soldiers and Three Black Crows" signals (three white candles or three black candles in a row) like this:
If LongOK = False And _
(Cells(Candle,
"L").Value - Cells(Candle, "I").Value) / Cells(Candle, "I").Value >
Trigger And _
(Cells(Candle +
1, "L").Value - Cells(Candle + 1, "I").Value) / Cells(Candle + 1,
"I").Value > Trigger And _
(Cells(Candle + 2,
"L").Value - Cells(Candle + 2, "I").Value) / Cells(Candle + 2,
"I").Value > Trigger Then
'The "Candle + 1" means one
day before today's candlestick, The "Candle + 2" means two days before
today's candlestick. Within these three days, Close prices (stored in
column L) are higher than Open prices (stored in column I) in a row, and
exceed at a certain point, the difference is bigger than the Trigger,
then the Long signal goes to OK.
LongOK = True
BCBM = Candle
BBP =
Round(Cells(Candle, "L").Value, 2)
Cells(Candle,
"N").Value = "Long OK " & Int([B20].Value * CP / 100 / BBP) & " @ " &
BBP
Exit Sub
End If
And generate the "Three
Black Crows" signal as below:
If ShortOK = False And _
(Cells(Candle,
"L").Value - Cells(Candle, "I").Value) / Cells(Candle, "I").Value < -1 *
Trigger And _
(Cells(Candle +
1, "L").Value - Cells(Candle + 1, "I").Value) / Cells(Candle + 1,
"I").Value < -1 * Trigger And _
(Cells(Candle + 2,
"L").Value - Cells(Candle + 2, "I").Value) / Cells(Candle + 2,
"I").Value < -1 * Trigger Then
'The "Candle + 1" means one
day before today's candlestick, The "Candle + 2" means two days before
today's candlestick. Within these three days, Close prices (stored in
column L) are lower than Open prices (stored in column I) in a row, and
exceed at a certain point, the difference is bigger than the Trigger,
then the Short signal goes to OK.
ShortOK = True
SCBM = Candle
SBP =
Round(Cells(Candle, "L").Value, 2)
Cells(Candle,
"N").Value = "Short OK " & Int(([B20].Value + 1.5 * [B19].Value *
SlPebP) / 1.5 * CP / 100 / SBP) & " @ " & SBP
Exit Sub
End If
On the next few days, if the
LongOK signal is On and the ShortOK signal is Off, then the VBA Macro will
open a Long position. Conversely, if the ShortOK signal is On and the LongOK
signal is Off, the program will open a Short position. Codes look like
these:
If BCBM - Candle >
[B7].Value Then LongOK = False
If SCBM - Candle >
[B7].Value Then ShortOK = False
'Open Long
If BCBM - Candle <=
[B7].Value Then
'
If LongOK = True And ShortOK = False And Cells(Candle, "I").Value
> BBP Then
If LongOK =
True And ShortOK = False Then
DlPe = Round((Cells(Candle, "J").Value + Cells(Candle,
"K").Value) / 2, 2)
If [B19].Value = 0 Then
TdSum = Int([B20].Value * CP / 100 / DlPe)
Cells(Candle, "O").Value = -1 * TdSum * DlPe
[B19].Value = [B19].Value + TdSum
PBM = DlPe
BM = [B20].Value + Cells(Candle, "O").Value + [B19].Value * PBM
[B20].Value = [B20].Value + Cells(Candle, "O").Value
Cells(Candle, "AE").Value = [B20].Value + [B19].Value *
Cells(Candle, "L").Value
Cells(Candle, "N").Value = "Buy/Open " & TdSum & " @ " & DlPe
End If
End If
End If
'Open Short
If SCBM - Candle <=
[B7].Value Then
'
If ShortOK = True And LongOK = False And Cells(Candle, "I").Value
< SBP Then
If ShortOK =
True And LongOK = False Then
DlPe = Round((Cells(Candle, "J").Value + Cells(Candle,
"K").Value) / 2, 2)
If [B19].Value = 0 Then
TdSum = Int([B20].Value / 1.5 * CP / 100 / DlPe)
Cells(Candle, "O").Value = TdSum * DlPe
[B19].Value = [B19].Value - TdSum
PBM = DlPe
BM = [B20].Value + Cells(Candle, "O").Value + [B19].Value * PBM
[B20].Value = [B20].Value + Cells(Candle, "O").Value
Cells(Candle, "AE").Value = [B20].Value + [B19].Value *
Cells(Candle, "L").Value
Cells(Candle, "N").Value = "Sell/Open " & TdSum & " @ " & DlPe
End If
End If
End If
VBA Macro will execute these
codes again and again, until finish all loops which are appointed by us.
According to all results, the program will delete bad parameters and retain
the good ones to pass to the next procedure.
The Scanning procedure looks
the same as the Digging procedure. All good parameters screened out from the
Digging procedure will be tortured (if you feel this word is too cruel,
replace it by “tested”) again in this part. We will use historical data from
the Testing set to test the parameters and simulate opening and closing
positions during the Testing set's time period. Most parameter combinations
will be eliminated because they fail to generate a profit, or the profit is
too low. Only the top-performing parameters have value and can be considered
as real fighters. In the end, we will let the winners scanned in the Testing
set run a full test, from day one to the most recent data, and screen out
the final competitors for future's real battles.
In the final stage, the VBA
Macro generates a chart which allows users to easily evaluate the results.
With just a glance at the curve, the pattern speaks for itself, better than
thousands of words. The curve may resemble something like this:
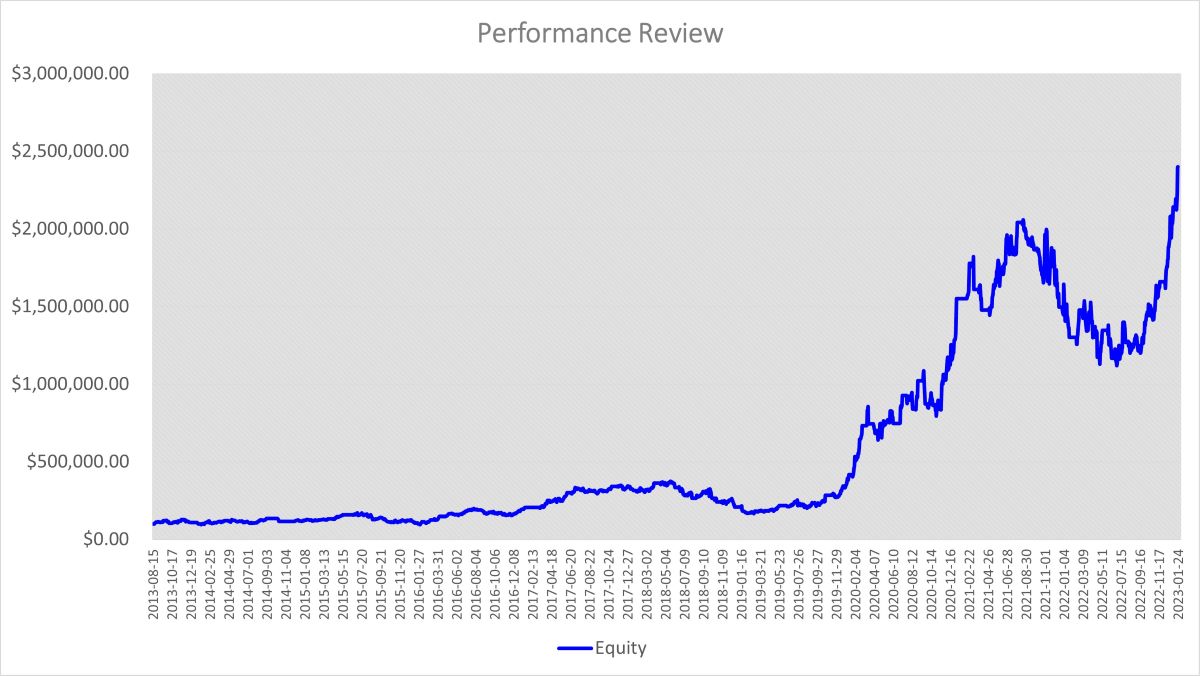
Can you guess which stock
this is? If I told you it was Tesla, you might say "No wonder", eh? The
curve appears like a roller coaster ride, eh? The ROI is so high (Annul ROI
goes to almost 40%), but it will also cause our blood pressure to rise high,
eh? The “Three White Soldiers” and “Three Black Crows” trading strategy
looks “WOW!”, but still require a lot of modifications and optimizations,
which we will cover in a future chapter.
 As we come to the end of
this chapter, let me remind you of a crucial fact: trading is not for
everyone. If you find yourself getting anxious or losing sleep over your
trades, it's time to take a break and re-evaluate your life choices. Maybe
knitting or stamp collecting is more your speed. As we come to the end of
this chapter, let me remind you of a crucial fact: trading is not for
everyone. If you find yourself getting anxious or losing sleep over your
trades, it's time to take a break and re-evaluate your life choices. Maybe
knitting or stamp collecting is more your speed.
But if you're still
determined to become a successful trader, remember to keep your sense of
humor intact. As Groucho Marx once said, "If you're not having fun, you're
doing something wrong." So laugh off your losses, celebrate your wins, and
don't forget to take a break from staring at those candlestick charts every
once in a while.
With that said, happy
trading and may the Three White Soldiers always march in your favor! (Just
don't get too close to the Three Black Crows.)
If you would like to try out
the “Three White Soldiers & Three Black Crows” strategy backtesting tool,
click on Free Trial to get a 30-day free trial
demo.
LIGHTING THE PATH TO PROFITABLE TRADING
(the whole tutorial handbook pdf Free Download)
A Step-by-Step Guide to Building a Trading
Strategy Verification Tool with VBA Macros
|