 After backtesting your
strategies, you need to analyze the results to see if they are profitable.
In this chapter, we will cover some basic metrics that you can use to
evaluate your strategy's performance.
After backtesting your
strategies, you need to analyze the results to see if they are profitable.
In this chapter, we will cover some basic metrics that you can use to
evaluate your strategy's performance.
Analyzing the results of
your backtesting is a critical step in evaluating the effectiveness of your
trading strategies. It helps you to identify strengths and weaknesses in
your approach and to make any necessary adjustments to improve your
strategy's performance.
There are several metrics
that you can use to evaluate your strategy's performance, including the
following:
1.
Profit and Loss (P&L): This
is the most basic metric for evaluating a trading strategy. It measures the
total profit or loss generated by the strategy over a specific period.
2.
Win Rate: Win rate is the
percentage of trades that are profitable. A high win rate does not
necessarily mean a profitable strategy.
3.
Turnover Period: It is
typically calculated as the average number of days between two actions. A
shorter turnover period is generally seen as more efficient, as it indicates
that the trading strategy is more robust.
4.
Maximum Drawdown: Maximum
drawdown is the largest decline in value experienced by a portfolio or
investment strategy from its peak value to its lowest value.
5.
Sharpe Ratio: The Sharpe
ratio is a measure of risk-adjusted return. It takes into account the return
of the investment relative to the risk involved.
6.
Average Profit and Loss per
Trade: This metric helps you to determine whether your strategy is making
enough money per trade to justify the risk.
7.
Average Holding Time:
Average holding time is the average length of time a trade is held. This
metric can help you to optimize your strategy's holding period.
By analyzing these metrics,
you can gain insights into the performance of your strategy and make
adjustments as needed to improve its profitability. It is important to
remember that no strategy is perfect, and there is always a risk of loss in
trading. However, by backtesting and analyzing your results, you can reduce
the risk and increase the chances of success.
In this demo version, we
provide several simple metrics to help users understand some basic ideas
about how to evaluate a trading strategy. For more complicated metrics, we
will add them in future releases. In this chapter, we will use another
trading strategy – “Golden Cross and Death Cross” – as an example to explain
how to analyze backtesting results.
Golden Cross is a bullish
technical analysis pattern that occurs when a short-term moving average
crosses above a long-term moving average. For example, a stock's 50-day
moving average crosses above its 200-day moving average. This pattern is
widely used by traders and investors to identify potential buying
opportunities.
The Golden Cross suggests
that the momentum of the stock is turning bullish, as the short-term moving
average is starting to rise above the long-term moving average. This can be
seen as a bullish signal, as it indicates that the stock's recent price
trends are starting to shift to the upside.
The "death cross" is a
technical chart pattern that occurs when a stock's short-term moving average
crosses below its long-term moving average, indicating a bearish trend. For
example, the stock's 50-day moving average crosses below its 200-day moving
average. This can be seen as a signal of increased selling pressure in the
market and a potential downturn in the stock's price. Some traders use the
death cross as a signal to sell their positions or to take a short position
in the stock.
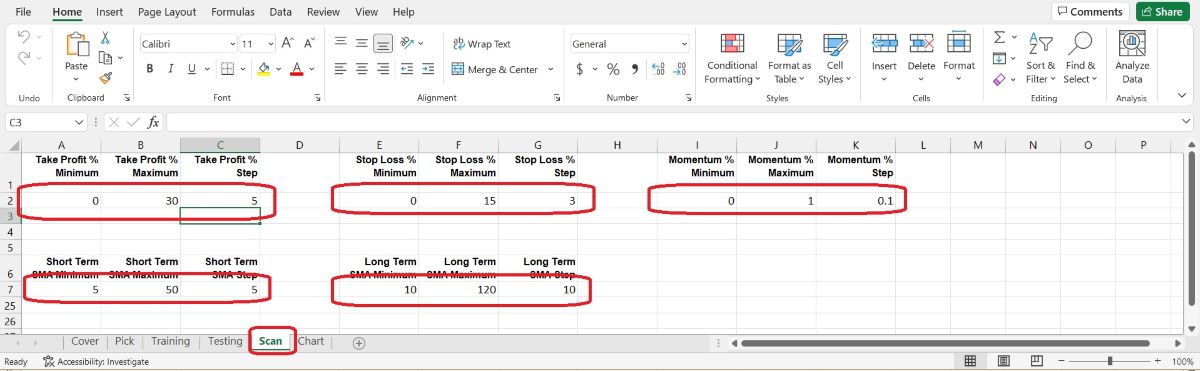
Let’s set parameter scanning
range in “Scan” worksheet like this:
After running the VBA tool,
we will get a series of parameter combinations in “Pick” worksheet like
this:
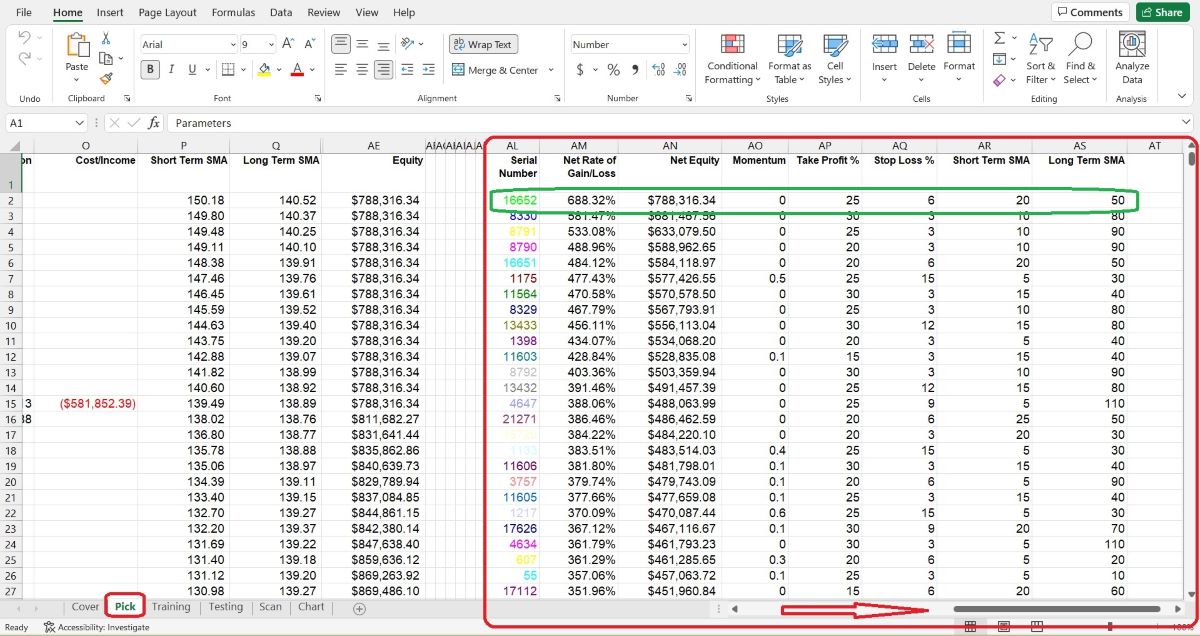
The VBA Macro will pick the
top one parameter combination (stored in cells AO2 to AS2) to print out a
chart:
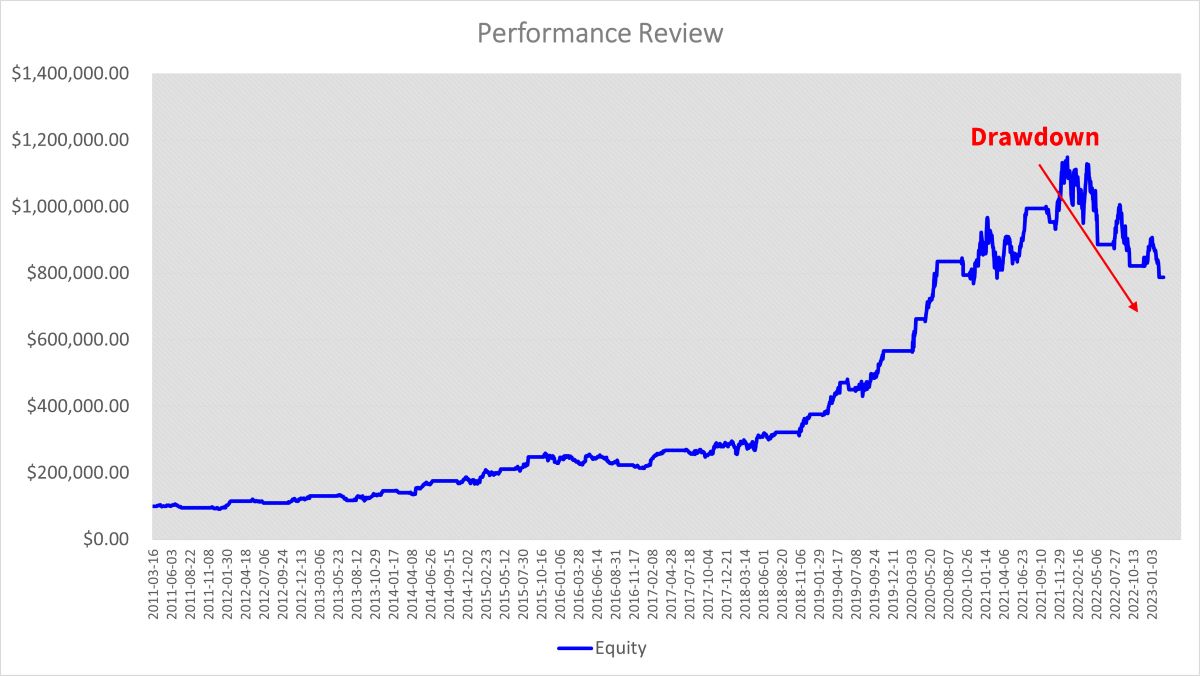
The Maximum Drawdown looks a
little bit ugly. And we can review this parameter combination‘s performance
metrics in worksheet “Pick”:
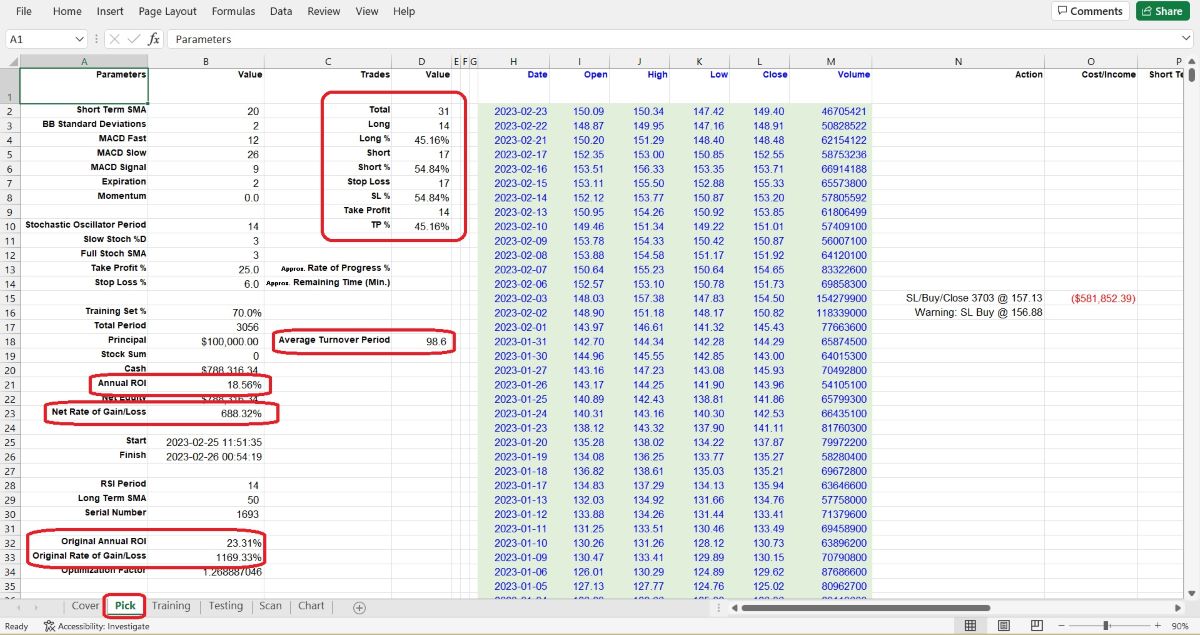
After a long run, since
2011-01-03 to 2023-02-23, which is a total of 3056 trading days, and with
the following parameters set: Momentum at 0, Take Profit at 25%, Stop Loss
at 6%, Short Term SMA at 20 days, and Long Term SMA at 50 days, we will get
an Annual ROI at 18.56%, not bad, eh? During this period, there were 31
trade deals completed, with 14 of them being long positions and 17 of them
being short positions. Stop loss was triggered 17 times, while take profit
was achieved 14 times. The ratio of stop loss vs. take profit was 54.84% vs.
45.16%. On average, it took 98.6 days to complete one full round of buying
and selling.
Now the ugly Drawdown and
the Annual ROI at 18.56% (on par with Warren Buffett's performance) come
together, can you accept that? Some people may enjoy high returns and can
bear temporary big losses, while others may prefer stability and may not
care if the profits are low. It depends on individual's investment
philosophy; we cannot say whether it is right or wrong.
Profit and risk are
inseparable in the market, and high profit comes with high risk, which is a
normal situation in the real trading world. For example, investing in a
startup company or a volatile cryptocurrency may offer the potential for
high returns, but also comes with a high level of risk. Conversely,
investing in a stable, blue-chip stock or a government bond may offer more
moderate returns, but also carries a lower level of risk.
While this VBA backtesting
tool can save time on calculations and charting, it cannot replace your own
decision-making process and critical thinking.
Still remember the TSLA’s
curve in chapter 4? Let’s review it here:
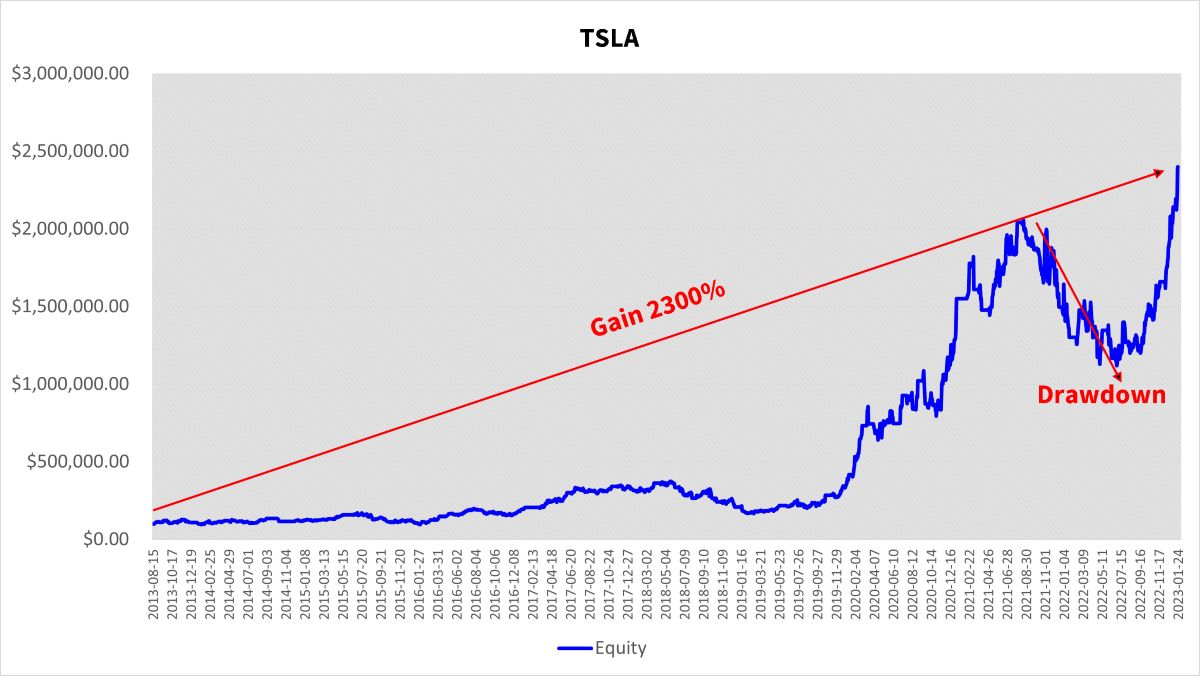
Since 2013-08-08 to
2023-01-24, the backtesting Annual ROI of TSLA using the
“WhiteSoldiers_BlackCrows” VBA Macro has been as high as 39.97%, and it has
gained a total of 2301.07%. This performance is not only better than Warren
Buffett’s average of 17%, but also higher than the original Tesla stock’s
ROI of 32.27% during the same period.

This return is based on the
parameter combination stored in cells AO2 to AQ2 of the "Pick" worksheet:
Momentum at 0.1, Take Profit at 20%, and Stop Loss at 12%, which is
indicated by a red frame as shown below:
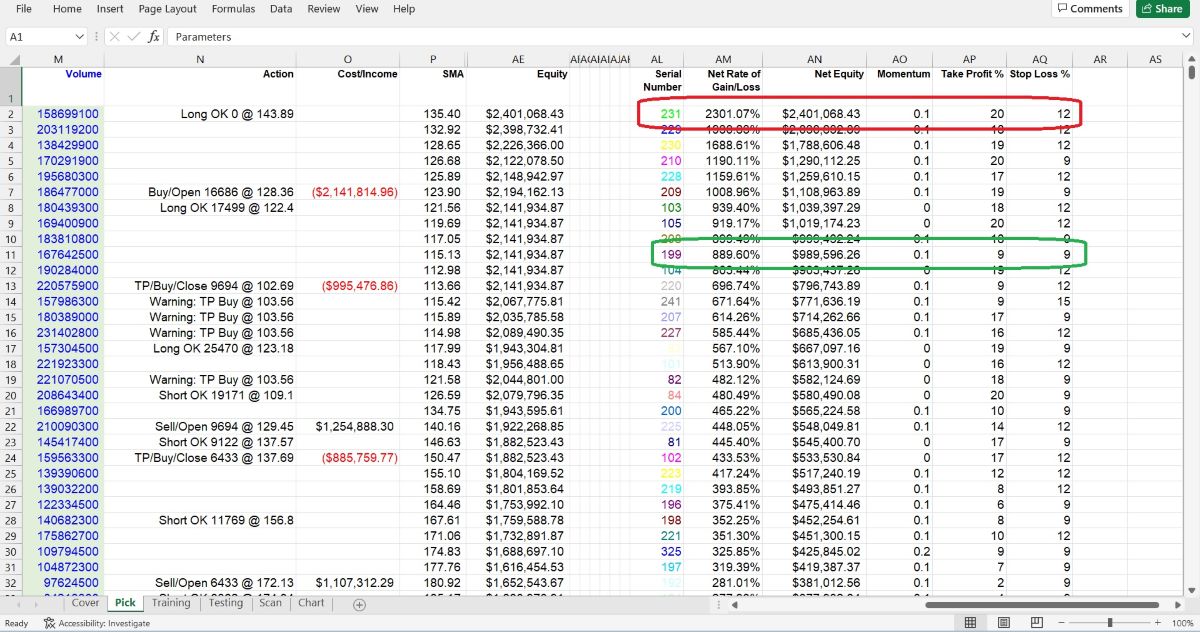
If you want to avoid a large
drawdown, try using a different set of parameters indicated by the green
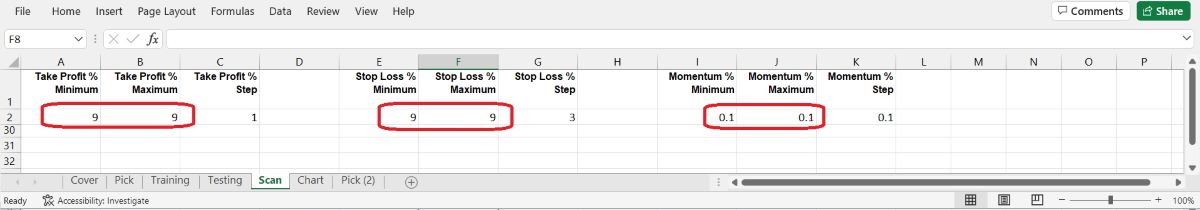
frame in cells AO11 to AQ11. Write down these values, go to the 'Scan'
worksheet, and enter them into the Take Profit, Stop Loss, and Momentum
cells. In this case, set both the 'Take Profit % Minimum' and 'Take Profit %
Maximum' to 9, and ignore the 'Take Profit % Step'. This setting tells the
VBA Macro to run this specific parameter combination only once, without
running all other loops. Similarly, set both the 'Stop Loss % Minimum' and
'Stop Loss % Maximum' to 9 (occasionally, here it is the same as the TP
group, but in other cases, it may be other values), and ignore the 'Stop
Loss % Step'. Then set both the 'Momentum % Minimum' and 'Momentum %
Maximum' to 0.1, and ignore the 'Momentum % Step'. Now run the VBA Macro,
the program will scan these settings particularly, and ignore other groups.
After pressing Control + Y,
you will quickly receive a new result:
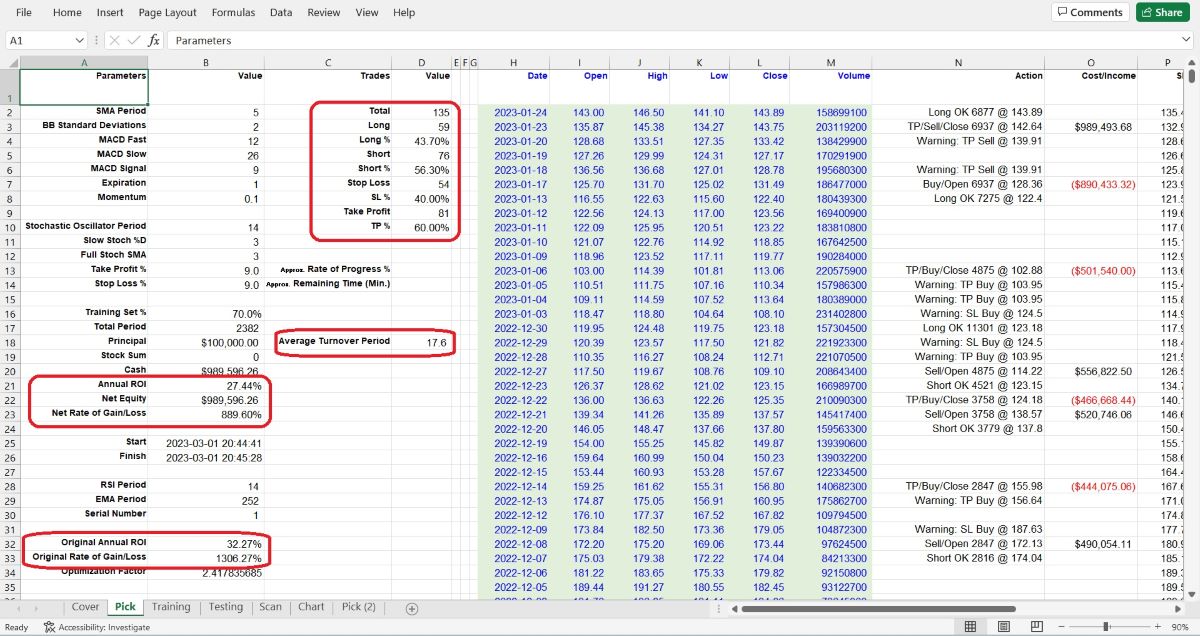
the Annual ROI drops to
27.44%, with 135 trade deals (almost double the number of trades than the
top-gun setting). The Take Profit to Stop Loss ratio is now 60% to 40%. The
drawdown…
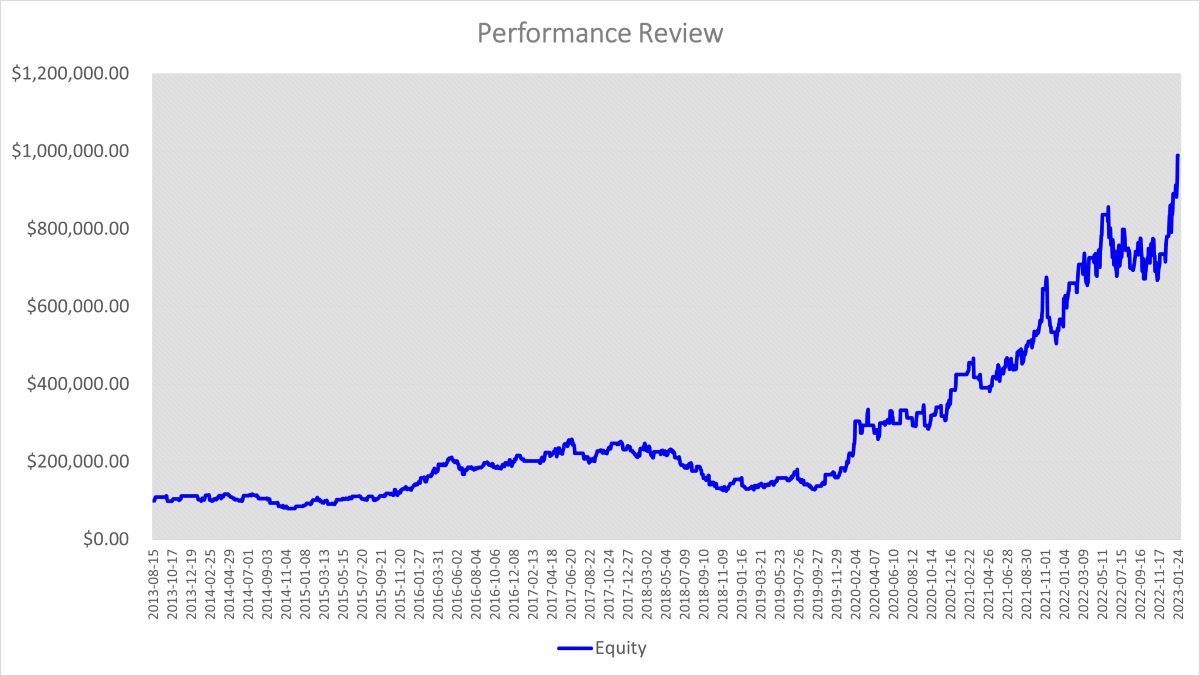
also looks more comfortable
and less severe, eh?
In conclusion, backtesting
cannot accurately predict how much profit we will make in the future, but it
can certainly calculate how much we have lost in the past if we have used a
wrong trading strategy, or how much we have missed out on if we own a strong
trading strategy but picked some weak parameters, heartbroken, eh?
As an example, let's
consider TSLA's historical data, which we split into a Training set (from
2013-08-08 to 2020-03-23) and a Testing set. If we pick the parameter
combination with serial number 229 and strictly follow the rules of the
"Three White Soldiers and Three Black Crows" strategy, obeying every signal
and plan to act from the Testing set's day one (2020-03-24) until
2023-01-24, which amounts to a total of 715 trading days…
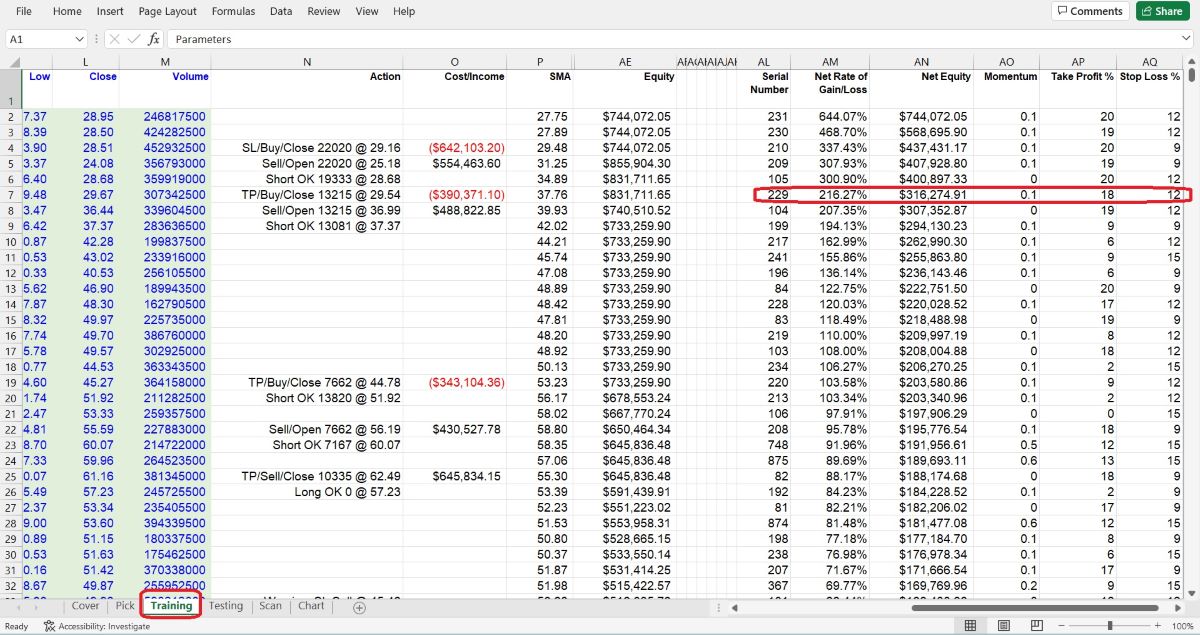
we could have gained…
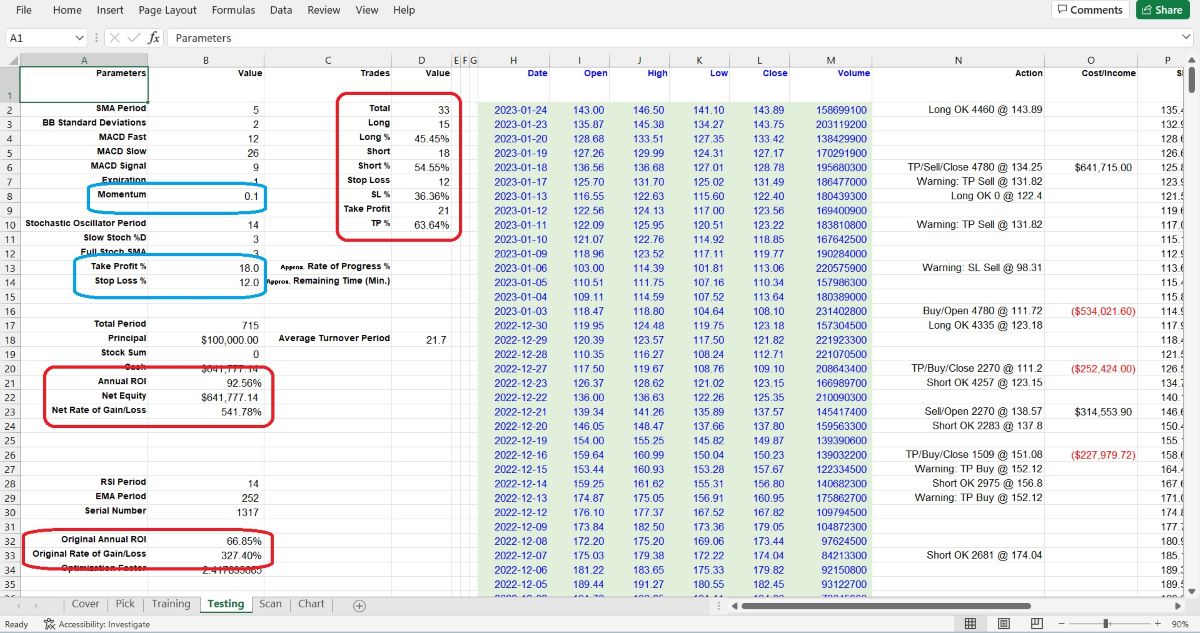
an explosive annual ROI of
92.56%!
Backtesting is a
cold-blooded truth teller, use it wisely. The trickiest challenge is how to
pick the right parameter combination, such as whether to pick serial number
229's parameters instead of the top one in Training set, which is serial
number 231. We never know what will happen tomorrow, even if we have a
powerful tool like backtesting. Ultimately, success depends on our own
experience, mindset and perhaps even… fate, eh?
As you analyze the results
of your backtesting, you might start to feel like a stock market Sherlock
Holmes, but don't forget to keep it fun! Just like in life, sometimes you
win, sometimes you lose, and sometimes you're just stuck in a holding
pattern. But with enough persistence and analysis, you'll eventually uncover
the clues to a profitable trading strategy. So grab your magnifying glass,
put on your deerstalker hat, and let's solve the mystery of the stock
market! (Disclaimer: No actual detective skills required.)
If you would like to try out
the “Golden Cross & Death Cross” strategy backtesting tool, click on
Free Trial to get a 30-day free trial
demo.
LIGHTING THE PATH TO PROFITABLE TRADING
(the whole tutorial handbook pdf Free Download)
A Step-by-Step Guide to Building a Trading
Strategy Verification Tool with VBA Macros