Big Innovation: Overview of different algorithmic trading strategies
|
|
Once upon a time, in the land of Wall Street, there was a group of traders
who relied on intuition and gut feelings to make their trades. They would
spend hours analyzing charts and financial reports, trying to predict the
future movement of stock prices. But little did they know, their kingdom was
about to be taken over by a group of nerdy algorithms. Yes, you heard it
right, algorithms that traded with mathematical models and statistical
analysis. The traders who once ruled the market were now forced to adapt or
become obsolete. But, like any good story, not all algorithmic strategies
were created equal. Some were mean and made you regret your investments,
while others followed trends like a loyal dog, and some even acted like a
superhero, exploiting price differences and saving the day. This is the tale
of algorithmic trading, where every strategy has its own unique set of
advantages and disadvantages. So sit back, grab a cup of coffee, and let’s
dive into the world of algo trading.
“Innovation distinguishes
between a leader and a follower.” — Steve Jobs
Algorithmic trading,
also known as automated trading or algo trading, is a method of executing
trades using computer algorithms. These algorithms use mathematical models
and statistical analysis to make decisions on buying and selling financial
instruments such as stocks, bonds, and commodities. The rise of algorithmic
trading has dramatically changed the financial landscape, offering many
benefits over traditional manual trading methods.
There are several
different algorithmic trading strategies that traders and investors can use,
each with its own set of advantages and disadvantages. In this article,
we’ll provide an overview of some of the most popular algorithmic trading
strategies, including their key characteristics and when they are best used.
Mean Reversion
Mean reversion is a statistical strategy that assumes
that the price of an asset will eventually return to its average price over
a given period of time. This strategy uses mathematical models to identify
when an asset is overpriced or underpriced and then executes trades based on
that information. Mean reversion strategies are often used in conjunction
with other strategies, such as trend following, to improve overall
performance.
For example, a trader uses a mean reversion algorithm to
track the average price of Apple (AAPL) stock over the past 100 days. If the
stock price rises significantly above its average, the algorithm may sell a
portion of the trader’s AAPL position. Conversely, if the stock price falls
significantly below its average, the algorithm may buy more AAPL shares.
Trend Following
Trend following is a strategy that assumes that an
asset’s price will continue to move in the same direction it has been
moving. This strategy uses mathematical models to identify the current trend
of an asset and then executes trades based on that information. Trend
following strategies are often used by long-term investors and traders who
are looking to profit from long-term price movements.
For instance,
an investor can use a trend following algorithm to track the direction of
the S&P 500 index. If the S&P 500 has been trending upwards for several
months, the algorithm may buy more index funds. If the S&P 500 starts
trending downwards, the algorithm may sell some of the index funds.
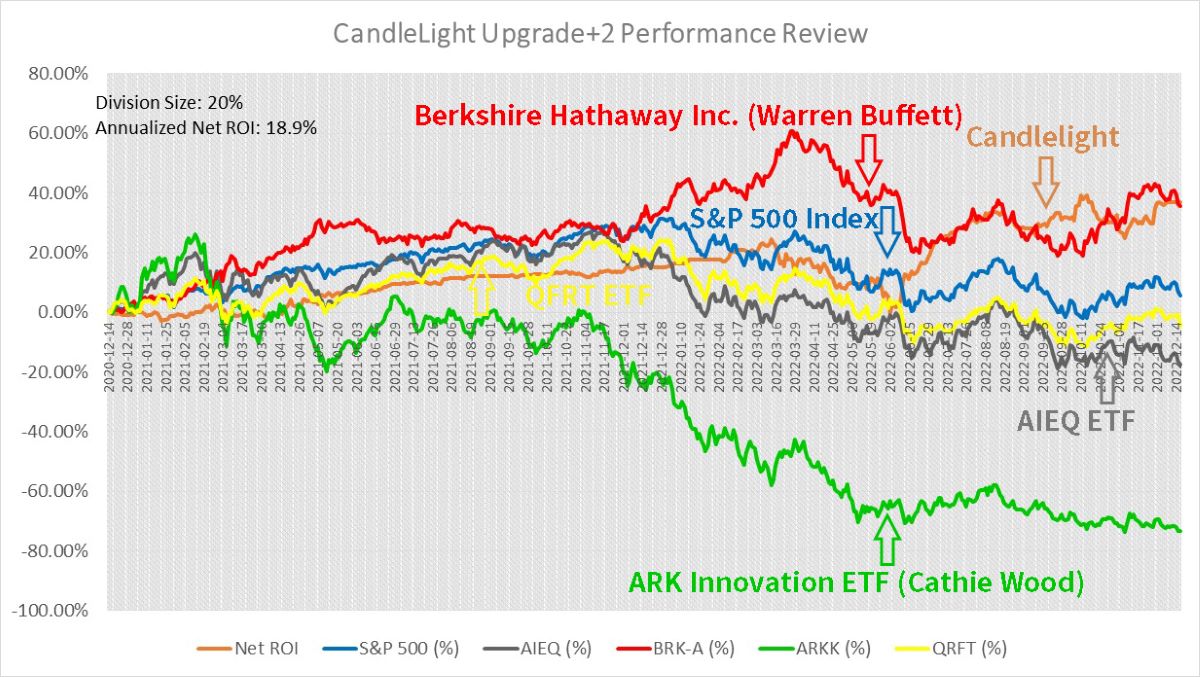
Another example, after months and months forward testing, Candlelight’s
Growth Rate is neck and neck with Buffett’s performance, decisions 100% made
by machines, details: Two Years,
100+ Sets of Testing Results Confirm: Machines Can Beat Human Aces in Stock
Market!
Statistical Arbitrage
Statistical arbitrage is a strategy that assumes
that there is a relationship between two or more assets, and that this
relationship can be used to make profitable trades. This strategy uses
mathematical models to identify and exploit price differences between
related assets. Statistical arbitrage strategies are often used by traders
and investors who are looking to profit from short-term price movements.
For example, a trader uses a statistical arbitrage algorithm to track
the price difference between two stocks, such as Google (GOOG) and Amazon
(AMZN). If the price difference between the two stocks deviates
significantly from its historical average, the algorithm may buy GOOG and
sell AMZN, or vice versa.
Momentum Trading
Momentum trading is a
strategy that assumes that an asset’s price will continue to move in the
same direction it has been moving, due to the momentum of the market. This
strategy uses mathematical models to identify the current momentum of an
asset and then executes trades based on that information. Momentum trading
strategies are often used by short-term traders and investors who are
looking to profit from short-term price movements.
For instance, a
trader may use a momentum trading algorithm to track the momentum of the
NASDAQ Composite Index. If the index has been rising steadily for several
days, the algorithm may buy technology stocks that are part of the index. If
the index starts to decline, the algorithm may sell some of the technology
stocks.
High-Frequency Trading
High-frequency trading is a
strategy that uses high-speed computers to execute trades at extremely fast
speeds, taking advantage of small price movements. This strategy uses
mathematical models to identify profitable trades and then executes trades
based on that information. High-frequency trading strategies are often used
by traders and investors who are looking to profit from short-term price
movements.
For example, a trader can use a high-frequency trading
algorithm to execute trades in milliseconds. The algorithm may track the
price of a stock, such as Tesla (TSLA), and place a buy order if the price
drops below a certain level or place a sell order if the price rises above a
certain level. This process may be repeated several times a day, taking
advantage of small price movements.
Algorithmic trading has come a
long way since its inception, and today it’s an integral part of modern
finance. As with any new technology, there are both advantages and
disadvantages to be considered. It’s important to note that algorithmic
trading strategies are not a one-size-fits-all solution, and what works well
for one trader may not work as well for another. As such, traders need to
carefully consider their own investment goals, risk tolerance, and market
knowledge before selecting an algorithmic trading strategy.
In order
to verify whether a trading strategy is effective, it’s essential to
backtest it under real market conditions. Without proper backtesting, using
any trading strategy can be risky. However, backtesting can be made easy
with a little knowledge of computer programming, such as Excel VBA.
Alternatively, you can seek help and tutorials online to learn the basics of
backtesting a trading strategy. For example, you can visit the Data
Gladiator Blog (tyzu.com) to access a comprehensive tutorial handbook for
free! Additionally, you can click Free Trial to download some backtesting
tools and enjoy a 30-day free trial.
And with that, folks, we have a
wrap on our overview of the popular algorithmic trading strategies. But
remember, always do your research and never let a robot make all your
financial decisions for you! After all, computers can crash, algorithms can
go haywire, and you don’t want to be the one left holding the bag… of stock,
that is. Happy trading!
“Innovation is not just creating something
new, it’s creating something better.” — Tim Cook
PS.
Two Years, 100+ Sets of Testing
Results Confirm: Machines Can Beat Human Aces in Stock Market! |


|

Free Tutorial
Share
|
|
|
|
